|
(3/28/09) From October of 2007 through early March of 2009
the Dow lost 54% of its value. Some other notable drops going back
to 1896 include 1906-1907 when the Dow lost 49%, 1929 (-49% in 3 months),
1931-1932 (-79%), 1937-1938 (-50%) and 1973-1974 (-48%). After these
substantial drops these were followed by sizeable rallies which included +89%
(1907-1908), +52% (1929-1930), +375% (1932-1936), +64% (1938) and +80%
(1973-1974). Thus as you can see there have been some impressive Rallies after the Dow has fallen around 50% in the
past. Since the early March Lows the Dow has gained
22.5%, Nasdaq (25.4%) and S&P 500 (24.7%) in 14 trading days which is
equivalent to 3 trading weeks. The overall pattern we are currently
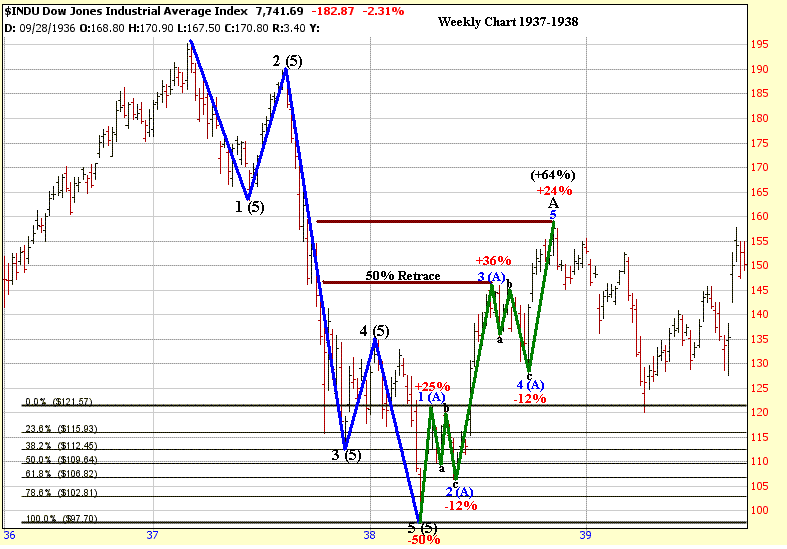
seeing is rather similar to what occurred from 1937 through 1938. A
weekly chart of the Dow from that time period is shown below. The
first thing to notice is the Elliott 5 Wave pattern that occurred from early
1937 through the early part of 1938 in which the Dow lost 50% of its
value. After Wave 5 (5) completed this was followed by a an ABC type
corrective rally. The "A" Wave up had a 5 wave structure
to it as the 1st Wave up 1 (A) saw the Dow gain 25% in 3 weeks. This was
then followed by a minor abc type pullback for Wave 2 down (2 A) in which the
Dow dropped back to its 61.8% Retracement Level for a 12%
correction. Next Wave 3 up (3 A) occurred in which the Dow gained
36% in 10 weeks as it stalled out right at its 50% Retracement Level calculated
from the 1937 high to the 1938 low. This was then followed by
another minor abc type pullback for Wave 4 down (4 A) in which the Dow lost 12%
again before the final 5th Wave up occurred in which the Dow gained another 24%
before peaking at its 61.8% Retracement Level near 158 which completed the
"A" Wave up. Overall from the low of Wave 5 (5) in early
1938 to the high made in late 1938 the Dow gained 64%. 
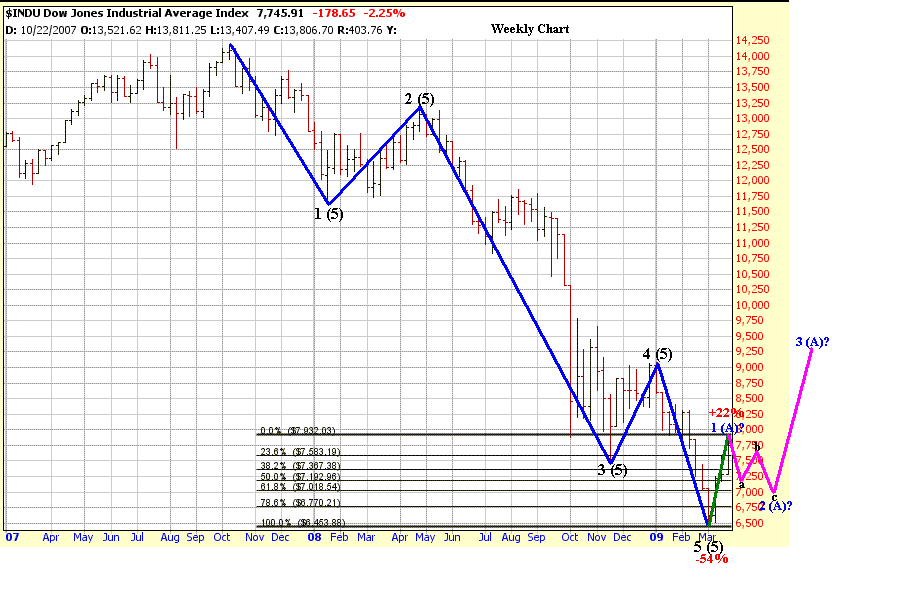
Now let's
look at a current chart of the Dow. Notice the same type of Elliott 5 Wave pattern
occurred from late 2007 to the final Wave 5 (5) in early March in which the Dow lost 54%
of its value. Over the past 3 weeks the Dow has rallied just over
22% so its possibly it may rise another 3% or so before we see completion of
Wave 1 (A). This would then be followed by Wave 2 (A) down which
would be a minor abc pullback with support coming in either at the 50% or 61.8% Retracement
Level. Once Wave 2 (A) ends then a strong Wave 3 (A) would occur
with the Dow potentially rising back above the 9000 level at some point later
this year if we did see a repeat of the 1938
pattern. 
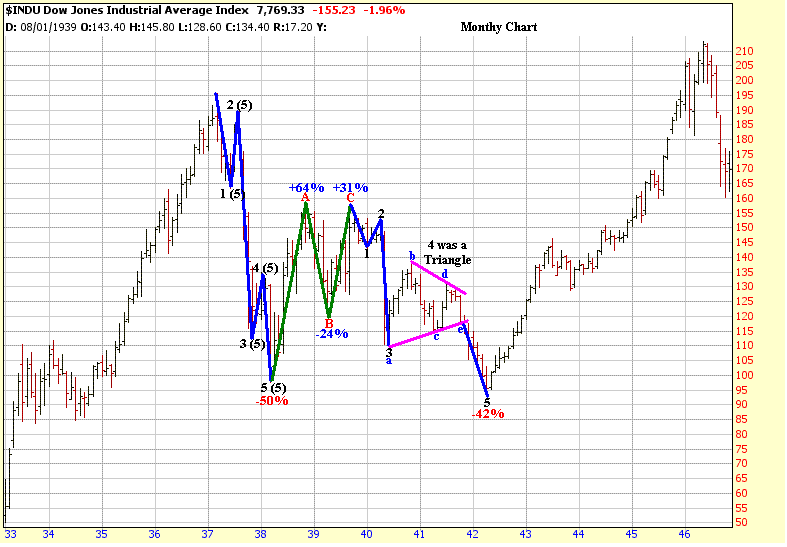
Meanwhile if we
take a longer term look at the Dow from the late 1930's through the early 1940's
notice once the "A" Wave peaked in late 1938 this was followed by the
"B" Wave down in which the Dow dropped 24%. Then after the
"B" Wave pullback the Dow rallied again but stalled out just below the
peak of Wave "A" as it completed Wave "C" to the upside with
a gain of 31%. Meanwhile once the ABC corrective rally ended then
the Dow went through another 5 Wave pattern to the downside before finally
making a low in early 1942 just below the low made in early 1938 as it fell 42%
from late 1939 through early 1942. 
So far the period
from late 2007 through early 2009 looks rather similar to the period from early
1937 through early 1938 so it will be interesting to see if the same type of
pattern occurs once again in the years ahead. At this time I
know many investors are frustrated because they missed the rally over the past 3
weeks. However if we are seeing a 5 Wave pattern developing for Wave
"A", as mentioned above, there will be plenty of opportunities to
reenter the market after we see a substantial pullback occur.
In 2008 our ETF Strategies worked the best with
which had a return of +33% versus the S&P 500 which was down -38.5% for the year.
Meanwhile our 401K Strategy finished up +17.3% for
the year.
Signup for a "Free 4 Week Trial Membership" or save
up to 50% on a Premium Membership and you will have access to these Investment
Products which include the following:
1. "ETF Daily Buy and Short Signals" which can be used to trade the
DIA's, QQQQ's, SPY's and OIH's. Our ETF
Strategy returned 33% in 2008.
2. "401K/Thrift Savings Plan (TSP) Timing Service" which can be
used to help improve your return in your 401k/TSP Account which was up +17.3% in
2008.
3. The "End of Month Strategy"
finished up +36.3% in 2008. This Strategy focuses on the typical End of
Month markup by the Institutional Money.
4. "Stocks to Buy List" which can be used with either our Short
Term Strategy or Long Term Strategy. In 2007 our Long Term Strategy
finished even for the year versus the S&P 500 which was down -38.5%.
Our Spring Membership Special for
new Members is shown below
which are 50% Off our normal Monthly Rate of $39.95
|
Membership Plans
|
Initial 50% Off
Introductory Rate
|
|
30 Day Trial Membership
|
FREE |
| Monthly Membership |
$19.95 |
| 6 Month Membership |
$119.95 |
All Trial and Regular
Memberships are on a renewal basis so please email
us to cancel your Membership before it
renews as they "aren't refundable".
After the Introductory Period expires Memberships
will automatically renew at our normal Monthly Discounted Rate of $21.95.
Send this Free Newsletter to a Friend or Relative
Amateur Investors
|


