|
(6/8/13)
I have been asked to comment about the Hindenburg Omen Indicator
since there have been some articles of late about it. Keep in mind
there are different databases out there with differing numbers so that will lead
to potentially different signal dates. The only database that is accurate
in my opinion is the one from the WSJ.
In addition one can only calculate values back to 1980 since the NYSE calculated
New 52 Week Highs and Lows in individual stocks differently prior to 1980. As
for me I use the following criteria to define a Hindenburg Omen using the WSJ
database. 1. The daily number of NYSE new 52 week highs and the daily number of new 52 week lows are both greater than or equal to
2.5 percent of the number of issues traded that day (some use 2.2% or 2.8%).
2. The NYSE Index is greater in value than it was 50 trading days ago
(some use a 10 Week Moving Average).
3. The McClellan Oscillator is negative on the same day.
4. New 52 week highs cannot be more than twice the new 52 week lows (although new 52 week lows may be more than double new highs).
5. Two Signals must occur within a period of 30 Trading Days (some use
only one signal to confirm a Hindenburg Omen). Meanwhile one key
feature many investors fail to include in their analysis when dealing with
Hindenburg Omen's is whether the market is overvalued or not. When
you factor in these two additional parameters (Shiller's PE Ratio is at least
"18" the prior month and the S&P 500 is 100% or more
above its 5 Year Low) then the number of signals is reduced to the following
time periods: September 1987, December 1999, October 2000, July 2007,
October 2007 and June 2013. List of Hindenburg Omen
Signals since 1980 along with the Shiller PE Ratio and % above the 5 Year Low
(Months when above criteria are met are highlighted in blue)
| Signal |
Shiller
PE |
%
above |
| Dates |
Ratio |
5
Year Low |
| Jul-86 |
13.6 |
148% |
| Sep-87 |
18.3 |
120% |
| Dec-99 |
43.2 |
222% |
| Oct-00 |
41.9 |
150% |
| Sep-05 |
26.1 |
62% |
| Apr-06 |
26.3 |
71% |
| Jul-07 |
27.4 |
102% |
| Oct-07 |
26.7 |
100% |
| Dec-10 |
21.7 |
89% |
| Jun-13 |
24.0 |
146% |
A review all of the prior Hindenburg Omen (H)) Signals
when the Shiller PE Ratio was above 18 and the S&P 500 was at least 100%
above its 5 Year Low follows.
The last Hindenburg Omen (HO) event occurred in the
Summer and Fall of 2007. The first HO Signal occurred in July of
2007 (point A) which was followed by an initial 12% correction. However in
this case the S&P 500 was able to rebound and make a slightly higher high
three months later in October (B) which coincided with another HO Signal. This was then followed
by a sharp sell off in which the S&P 500 lost 58% of its value over the next
18 months. 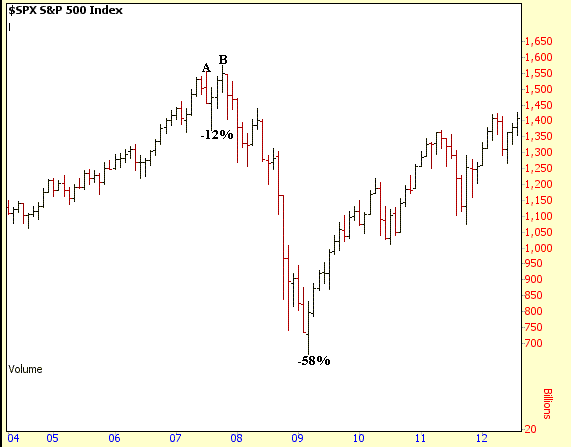
The next HO event was in late 1999
and 2000. There first HO
signal occurred in December of 1999 (point C) which was followed by an initial correction of
10%. However the S&P 500 was able to rebound and make a higher high by March of 2000
(point D). Meanwhile a 2nd HO Signal occurred in October of 2000
(point E) which was followed by a significant sell off. Overall the
S&P 500 lost 50% of its value from March of 2000 through October of
2002. 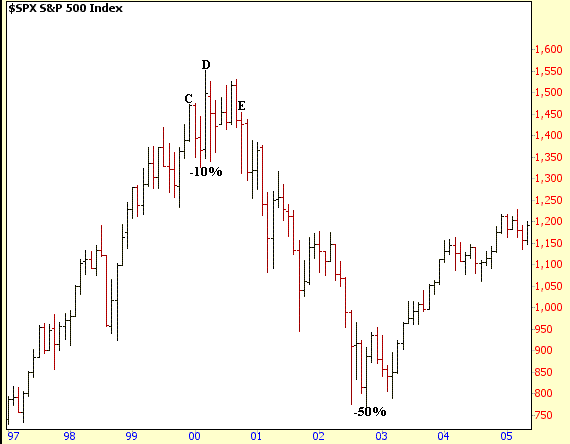
Finally the last HO event occurred
in September of 1987 (point F) which was followed by a sharp 36% drop over a
period of two months in the S&P 500. In this case the S&P 500
peaked the month before. 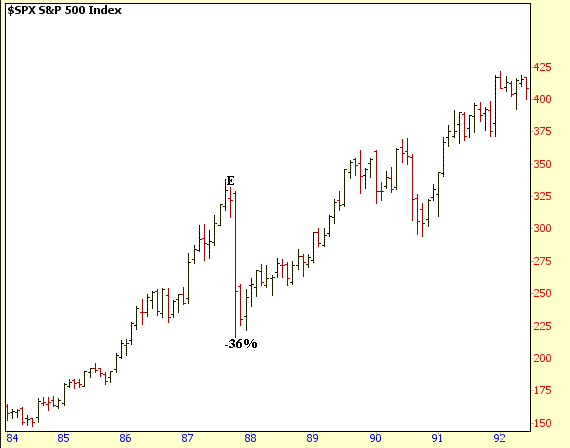
Recently another HO Signal occurred
on June 3 so we shall see how this latest signal plays out. As we saw with
the HO Signals in the Summer of 2007 and back in late 1999 it's possible the
S&P 500 could make a slightly higher high before a much larger correction
develops in the longer term.
Signup for a "Free 4 Week Trial Membership" or save
up to 50% on a Premium Membership and you will have access to the following
products.
1. "ETF Daily Buy and Short Signals"
which can be used to trade the DIA's, QQQQ's and SPY's.
2. "401K/Thrift Savings Plan (TSP) Timing
Service" which can be used to help improve your return in your 401k/TSP
Account.
3. The "End of Month Strategy".
This Strategy focuses on the typical End of Month markup by the Institutional
Money.
4. "Stocks to Buy List" which can be
used with either our Short Term Strategy or Long Term Strategy.
Our Summer Membership Special for
new Members is shown below
which are 50% Off our normal Monthly Rate of $39.95
|
Membership Plans
|
Initial 50% Off
Introductory Rate
|
|
30 Day Trial Membership
|
FREE |
| Monthly Membership |
$19.95 |
| 6 Month Membership |
$119.95 |
All Trial and Regular
Memberships are on a renewal basis so please email
us to cancel your Membership before it
renews as they "aren't refundable".
After the Introductory Period expires Memberships
will automatically renew at our normal Monthly Discounted Rate of $21.95.
Send this Free Newsletter to a Friend or Relative
Amateur Investors
|

