|
(6/29/13)
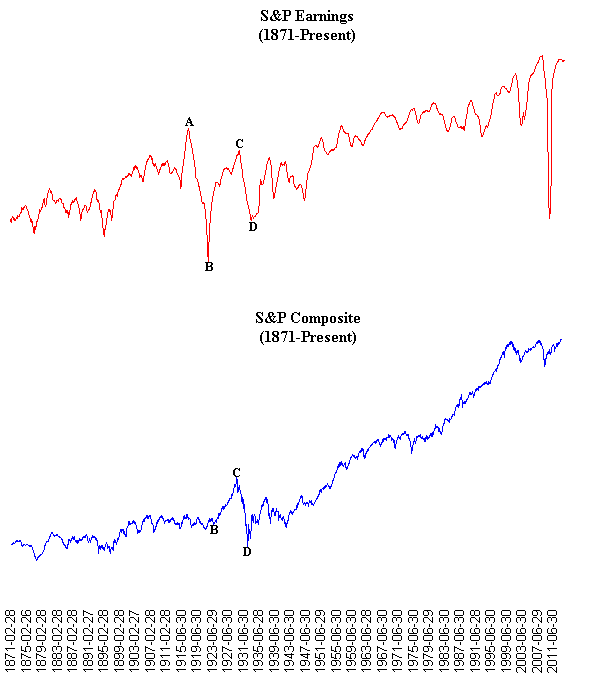
The chart below shows Corporate Earnings in the S&P
Composite from 1871 to present (red line) versus the S&P Composite (blue
line). The rebound in Corporate Earnings after the massive drop in 2008 is
similar to what occurred back in the early 1900's. Back then Corporate
Earnings crashed after World War I ended (points A to B) however this was then
followed by a sharp rebound in the 1920's (points B to C). This lead to
the Roaring 20's along with a substantial rally in the S&P Composite through
1929. However they quickly found out in the early 1930's Newton's Law of
Gravity would come into play as the rapid spike upward in Corporate Earnings was
not sustainable. This lead to another drop in Earnings (points C to D)
which coincided with the early 1930's market crash.
 Meanwhile the current
turnaround in Corporate Earnings since 2009 is even more parabolic than what
occurred in the 1920's. It's obvious the current trend in Corporate
Earnings isn't sustainable and a pullback will follow. The question
is how deep will the pullback be and what affect it will have on the
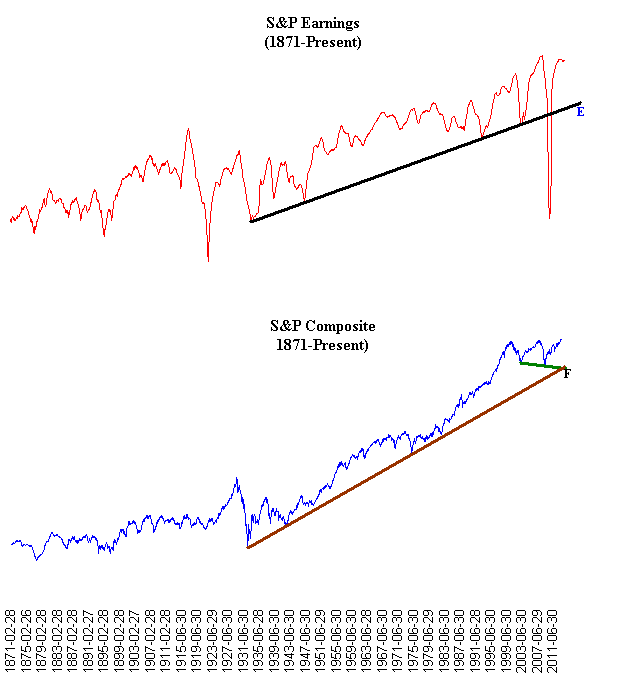
market? As you can see there is a longer term trend line (black
line) connecting prior bottoms in Earnings (neglecting the big drop in 2008) so
this would be a possible target (point E). Furthermore the S&P
Composite also has a longer term upward trend line (brown line) dating back to
the early 1930's which would intersect the trend line connecting the 2002 and
2009 lows (green line) just below the prior 2009 low (point
F).

Signup for a "Free 4 Week Trial Membership" or save
up to 50% on a Premium Membership and you will have access to the following
products.
1. "ETF Daily Buy and Short Signals"
which can be used to trade the DIA's, QQQQ's and SPY's.
2. "401K/Thrift Savings Plan (TSP) Timing
Service" which can be used to help improve your return in your 401k/TSP
Account.
3. The "End of Month Strategy".
This Strategy focuses on the typical End of Month markup by the Institutional
Money.
4. "Stocks to Buy List" which can be
used with either our Short Term Strategy or Long Term Strategy.
Our Summer Membership Special for
new Members is shown below
which are 50% Off our normal Monthly Rate of $39.95
|
Membership Plans
|
Initial 50% Off
Introductory Rate
|
|
30 Day Trial Membership
|
FREE |
| Monthly Membership |
$19.95 |
| 6 Month Membership |
$119.95 |
All Trial and Regular
Memberships are on a renewal basis so please email
us to cancel your Membership before it
renews as they "aren't refundable".
After the Introductory Period expires Memberships
will automatically renew at our normal Monthly Discounted Rate of $21.95.
Send this Free Newsletter to a Friend or Relative
Amateur Investors
|


