|
(1/8/11)
For those that follow the Relative Strength Index (RSI) 1900 significant Market
Bottoms have occurred under certain conditions involving the RSI.
The chart below is a plot of an 18 Period Monthly RSI which is smoothed by a simple 5
Month Moving Average. Notice when the smoothed RSI has dropped
below the 35 level and then risen back above it (points A) major bottoms have
occurred on "5" different occasions (points B) with the most recent
one in the Spring of 2009. Furthermore all of these major bottoms were
followed by sharp oversold rallies exceeding 75% over a relatively short period
of time. 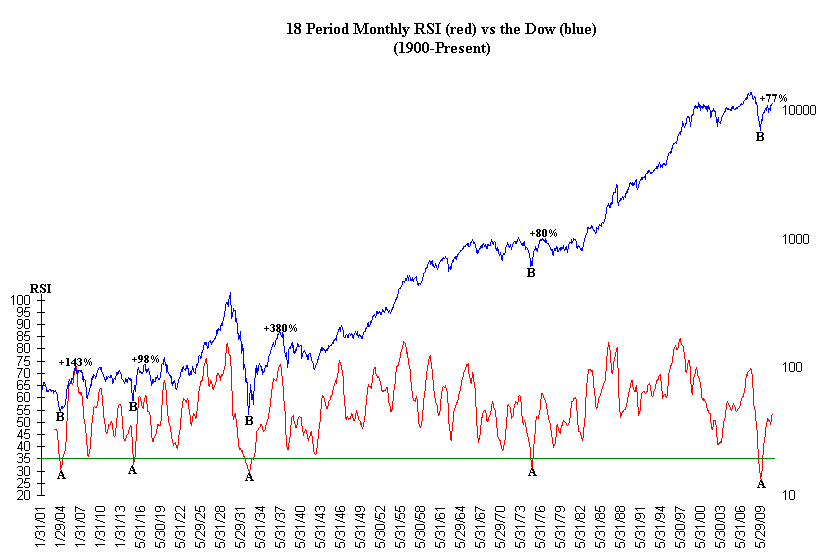
Meanwhile a breakdown of the
past 4 occurrences will now be shown with the first one way back in the early
1900's. In this case the Dow dropped 46% from its 1901 high before
bottoming in late 1903. This was then followed by a 143% rally over the
next 2 years which peaked in late 1905. After rallying 143% the Dow
then sold off over the next two years and lost 45% of its value before bottoming
in late 1907 near its 78.6% Retrace calculated from the late 1903 low to the
late 1905 peak.. 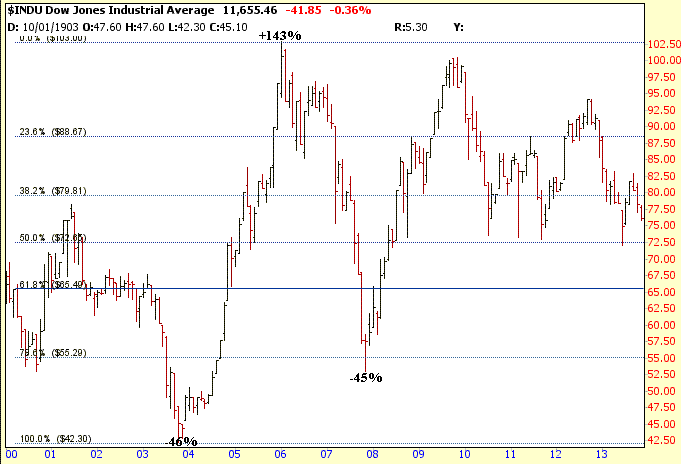
Meanwhile the next RSI occurrence happened in 1915 as the Dow lost 47% of its value from late 1909
through late 1914. This was then followed by a 98% rally over the
next 2 years which peaked in late 1916. Meanwhile after
rallying 98% the Dow then went through a sharp 40% correction over the next year
as it found support once again at its 78.6% Retracement Level calculated from
the late 1914 low to the late 1916 high. 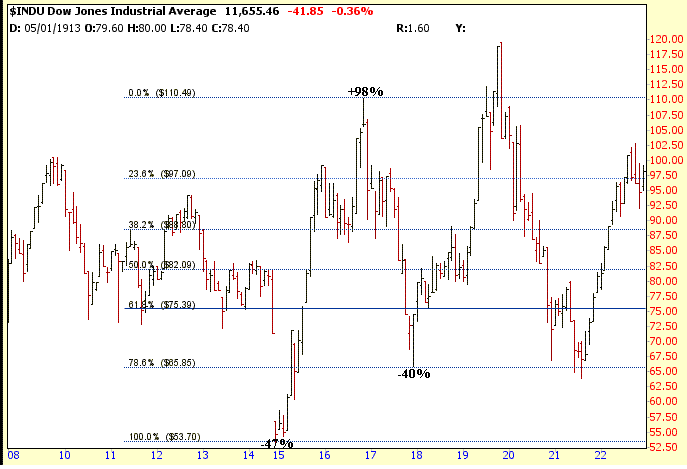
The next RSI occurrence
was in 1932 after the big market crash from the late 1929 peak as the Dow lost
89% of its value before bottoming in July of 1932. This was then
followed by a sharp rally over the next 4 years as the Dow gained 380% before
peaking in early 1937. Meanwhile after topping in early 1937 the Dow
then went through a choppy correction over the next 5 years in which it lost 53%
of its value. Also notice it found support twice near its 61.8%
Retracement Level (points C) calculated from the July 1932 low to early 1937
high. 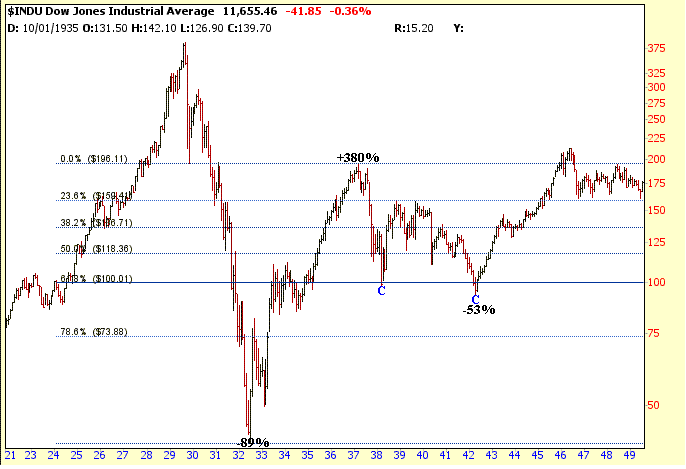
Another RSI Signal occurred in the mid
1970's as the Dow lost 47% of its value from early 1973 through early 1975 which
was then followed by a sharp 80% rally over the next 18 months which took the
shape of an "ABC" affair. This was then followed by a 28%
correction over the next 18 months as the Dow found support near its 61.8%
Retracement Level calculated from the early 1975 low to the late 1976
high. Furthermore as I have pointed out in the past after the 1976
top the Dow traded in a choppy trading range for the next 7 years before finally
breaking out in 1983 as it continued to hold support at or above its 61.8%
Retracement Level (red line). 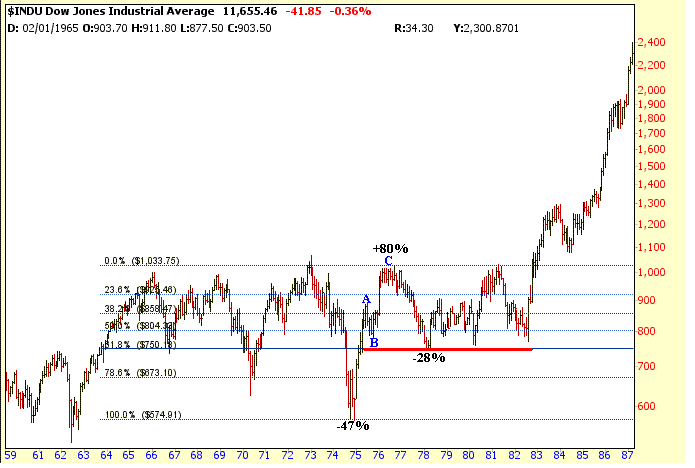
Meanwhile the most
recent RSI Signal occurred in the Spring of 2009 as the Dow lost 54% of its
value over a 17 month period which has been followed by a sharp 77% rally over
the past 22 months. So far this pattern looks very similar to the mid
1970's pattern and is exhibiting an "ABC" affair as well from the March 2009
low. If the Dow is nearing a top and eventually retraces 61.8% like
occurred in the mid 1970's then a drop back to around the 8500 level is
certainly not impossible in the long run. Also a 61.8%
retrace back to the 8500 level would correspond to a 28% correction which is
what occurred in the mid 1970's as shown above. 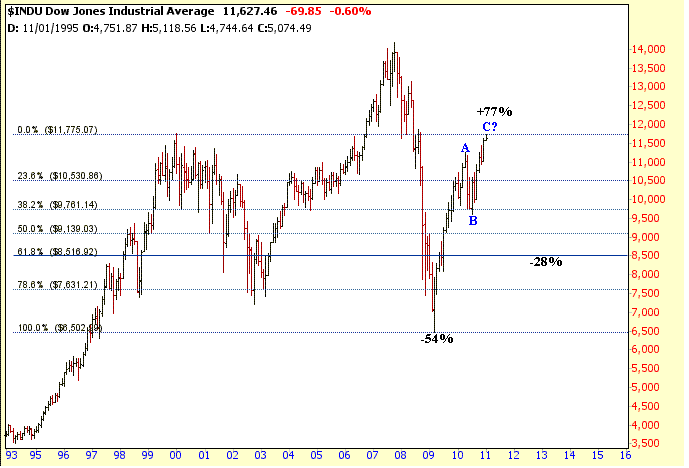
To sum things up
what this research shows is that the move from the March 2009 low is nothing
unusual as there have been previous occurrences in the past after the market has
become extremely oversold and the smoothed 18 Period RSI has dropped below the
35 level. Also after each impressive oversold rally the Dow
eventually retraced anywhere from 61.8% to 78.6% of the previous upward move as
it corrected from 28% to 53%. Meanwhile as shown above the current
pattern most resembles the one from the mid 1970s which would mean an extended
consolidation period would develop over the next several years with support
coming in at the 61.8% Retracement Level.
Signup for a "Free 4 Week Trial Membership" or save
up to 50% on a Premium Membership and you will have access to the following
products.
1. "ETF Daily Buy and Short Signals"
which can be used to trade the DIA's, QQQQ's and SPY's.
2. "401K/Thrift Savings Plan (TSP) Timing
Service" which can be used to help improve your return in your 401k/TSP
Account.
3. The "End of Month Strategy".
This Strategy focuses on the typical End of Month markup by the Institutional
Money.
4. "Stocks to Buy List" which can be
used with either our Short Term Strategy or Long Term Strategy.
Our Winter Membership Special for
new Members is shown below
which are 50% Off our normal Monthly Rate of $39.95
|
Membership Plans
|
Initial 50% Off
Introductory Rate
|
|
30 Day Trial Membership
|
FREE |
| Monthly Membership |
$19.95 |
| 6 Month Membership |
$119.95 |
All Trial and Regular
Memberships are on a renewal basis so please email
us to cancel your Membership before it
renews as they "aren't refundable".
After the Introductory Period expires Memberships
will automatically renew at our normal Monthly Discounted Rate of $21.95.
Send this Free Newsletter to a Friend or Relative
Amateur Investors
|

