|
(1/3/09)
For the year the Dow lost 33.8% of its value which was the 3rd
worst Yearly Performance going all the way back to 1896 as shown in the table
below. The worst performing year was in 1931 in which the Dow lost nearly
53%. Top 10 Worst Performance Years for the Dow
(1896-2008)
| 1931 |
-52.67 |
| 1907 |
-37.73 |
| 2008 |
-33.84 |
| 1930 |
-33.77 |
| 1920 |
-32.9 |
| 1937 |
-32.82 |
| 1914 |
-30.72 |
| 1974 |
-27.57 |
| 1903 |
-23.61 |
| 1932 |
-22.64 |
| 1917 |
-21.71 |
Meanwhile if we look at some weekly charts of the major averages
they all are exhibiting a rather classic looking Elliott 5 Wave pattern to the
downside. A simple example of what a 5 Wave pattern looks like is shown
below. Notice Waves 1,3 and 5 are to the downside while Waves 2 and
4 are corrective to the upside. Once the 5 Wave pattern completes
itself this is then followed by an "ABC" type rally. 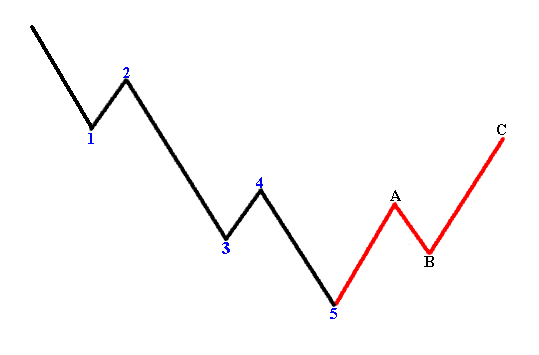
A weekly chart
of the Dow shows it's exhibiting a rather similar pattern as shown above and
currently is undergoing the corrective 4th Wave up after completing Wave 3 down
on November 21st. Of course the big question is how much further
will Wave 4 up go before it ends which will then be followed by the 5th Wave
down? My guess would be the Dow may attempt to rally up to the 9450 to
9600 range before Wave 4 ends. The 9450 area corresponds to the
Dow's 20 Week EMA (green line) while the 9600 level is the 38.2% Retracement
Level calculated from the peak of Wave 2 to the bottom of Wave 3. 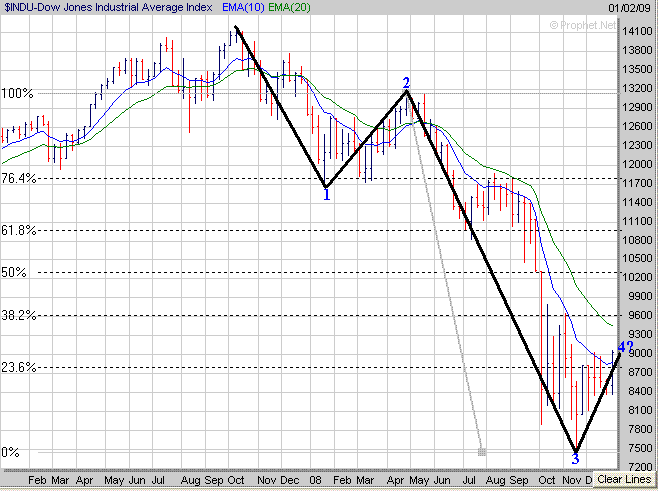
The Nasdaq just like the Dow is
exhibiting a similar looking pattern and is currently going through the 4th Wave up
after completing Wave 3 down on November 21st. It looks like the Nasdaq
could potentially rally up to the 1760 area before the 4th Wave up
ends. The 1760 level is near the Nasdaq's 20 Week EMA (green line)
and 38.2% Retracement Level calculated from the peak of Wave 2 to the bottom of
Wave 3. 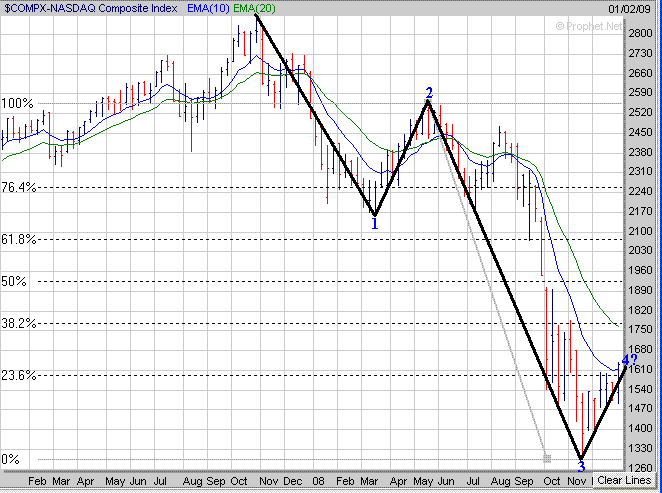
As far as the S&P 500 it's also
showing a similar pattern to the Dow and Nasdaq as it undergoes Wave 4 up.
At this point it looks
like the S&P 500 could potentially rise up to around the 1000 level before
the 4th Wave up ends. The 1000 level is where the S&P 500's 20 Week
EMA (green line) and 38.2% Retracement Level (calculated from the peak of Wave 2
to the bottom of Wave 3) reside at. 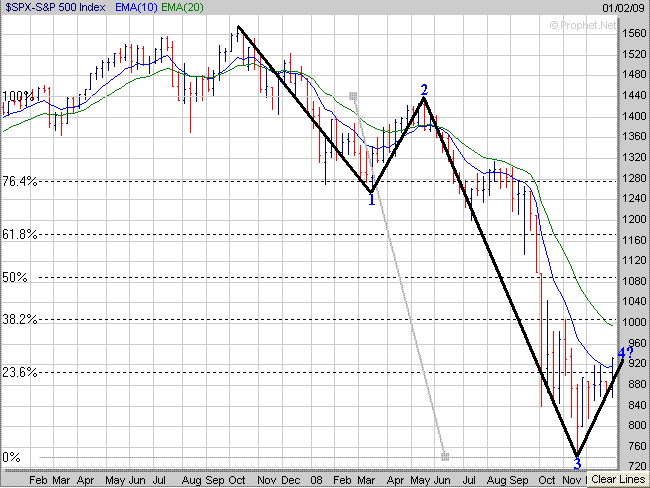
Keep in mind once the 4th Wave up
ends this will be followed by the 5th Wave down which would likely see new lows
made in the major averages at some point in 2009. Finally
one thing that bears watching is the Volatility Index (VIX) which has decreased
substantially since the November 21st lows (points A to B). This
rapid drop is similar to what occurred from mid October through early November
(points C to D) which was followed by a sharp sell off in the S&P 500
(points E to F). Thus this is a warning sign that a sharp correction
could development at anytime. 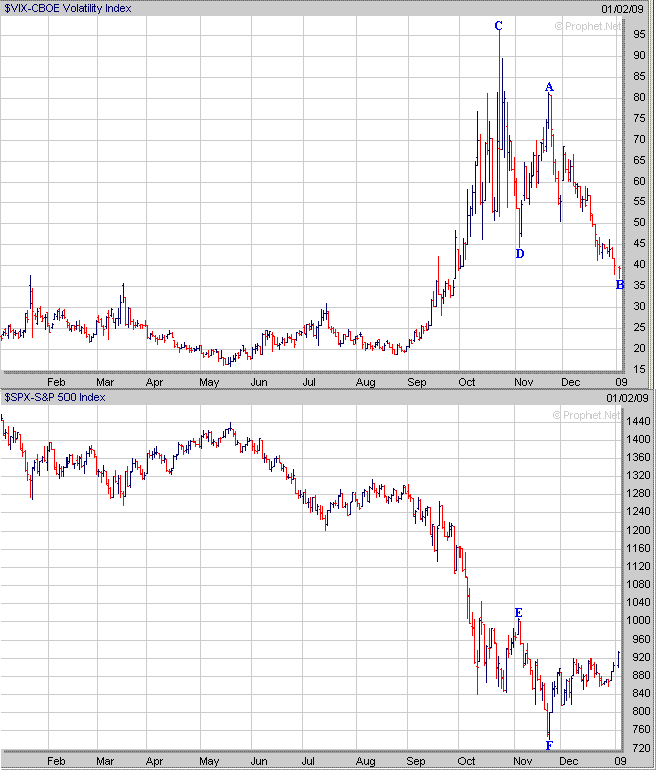
In 2008 our ETF Strategies worked the best with
which had a return of +33% versus the S&P 500 which was down -38.5% for the year.
Meanwhile our 401K Strategy finished up +17.3% for
the year.
Signup for a "Free 4 Week Trial Membership" or save
up to 50% on a Premium Membership and you will have access to these Investment
Products which include the following:
1. "ETF Daily Buy and Short Signals" which can be used to trade the
DIA's, QQQQ's, SPY's and OIH's. Our ETF
Strategy returned 33% in 2008.
2. "401K/Thrift Savings Plan (TSP) Timing Service" which can be
used to help improve your return in your 401k/TSP Account which was up +17.3% in
2008.
3. The "End of Month Strategy"
finished up +36.3% in 2008. This Strategy focuses on the typical End of
Month markup by the Institutional Money.
4. "Stocks to Buy List" which can be used with either our Short
Term Strategy or Long Term Strategy. In 2007 our Long Term Strategy
finished even for the year versus the S&P 500 which was down -38.5%.
Our Winter Membership Special for
new Members is shown below
which are 50% Off our normal Monthly Rate of $39.95
|
Membership Plans
|
Initial 50% Off
Introductory Rate
|
|
30 Day Trial Membership
|
FREE |
| Monthly Membership |
$19.95 |
| 6 Month Membership |
$119.95 |
All Trial and Regular
Memberships are on a renewal basis so please email
us to cancel your Membership before it
renews as they "aren't refundable".
After the Introductory Period expires Memberships
will automatically renew at our normal Monthly Discounted Rate of $21.95.
Send this Free Newsletter to a Friend or Relative
Amateur Investors
|


