|
(1/22/11)
Since I have received some inquiries regarding whether the S&P
500 can rise back to the late 2007 level here is the type of pattern that would
likely pan out over the next year or so which is a "Broadening
Top". If this type of pattern is
developing then the S&P 500 would eventually rally back above its
previous 2007 high which was at 1576. Currently the move up
from the March 2009 low would be the final 5th Wave. However keep in mind once this pattern completes then a large sell off
or consolidation pattern would follow with potential retest of the longer term downward trend line. 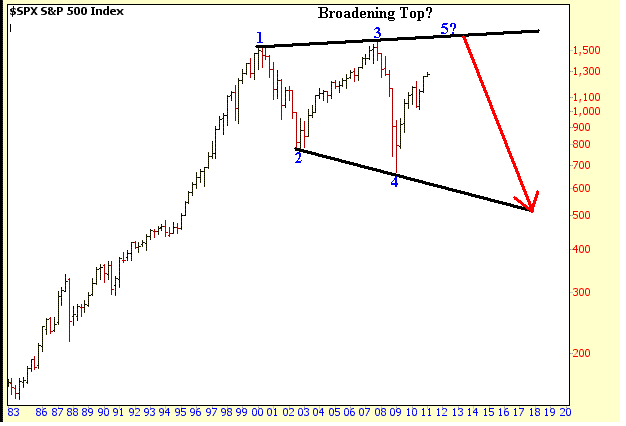
Meanwhile a longer term chart of the
S&P Composite is shown below. Values before 1928 were
based on research done by Robert
Shiller who calculated monthly values for the S&P Composite going
way back to 1871. Notice there
have been two
other Broadening Top patterns during the past 140 years in the S&P
Composite. The first one was in the early 1970's and the other in the early
1900's. Notice once the Broadening Top pattern completed in the early 1970's a sharp
48% sell off followed. Meanwhile the other Broadening Top pattern
completed in the early
1900's (1912 to be exact) and was then followed by a choppy 9 year
consolidation period through 1921 in which the S&P Composite lost 37% of its
value over an extended period of time. Thus it's not impossible that a repeat of one of these two past
occurrences could happen again if the S&P does rise back to the late 2007
high within the next two years. 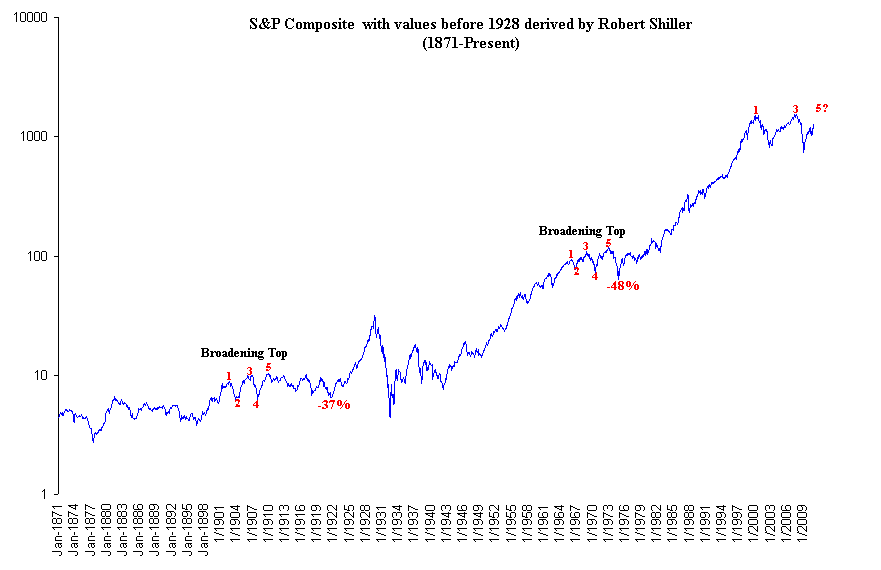
Meanwhile a closer look at the
Broadening Top pattern from the early 1970's shows the final 5th Wave acted like an "ABC" type affair. 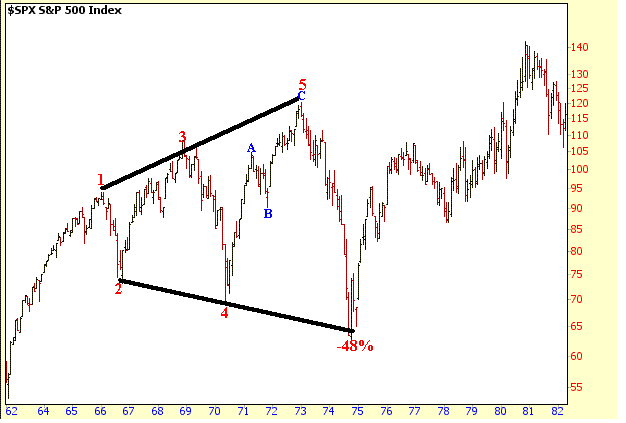
Now if a Broadening
Top pattern is developing then the move from March 2009 to April of 2010 was
likely "A" of an "ABC" affair which was followed by
"B" that corresponded to the July low. Furthermore the recent move up from the July low 1011
would be the 1st Wave of a larger 5 Wave pattern for "C". Meanwhile a Wave 2 pullback should
develop soon with support coming in at or above the 61.8% Retrace around 1120
(calculated from 1011 to 1296). This would then be followed by Wave's 3, 4 and 5
to complete the pattern just above the 2007 high of 1576 probably around 1600 or
so. Naturally this would be bullish over the next year or two but
then turn bearish in the longer term as a potential retest of the longer term downward
trend line would eventually occur after 2015. 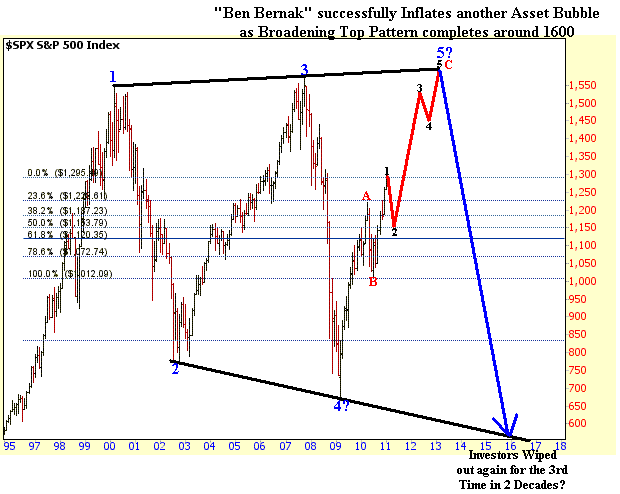
Finally also
notice the longer term upward trend line in the S&P Composite (green line)
would eventually intersect with the current downward trend line (black line) as
well at point A? 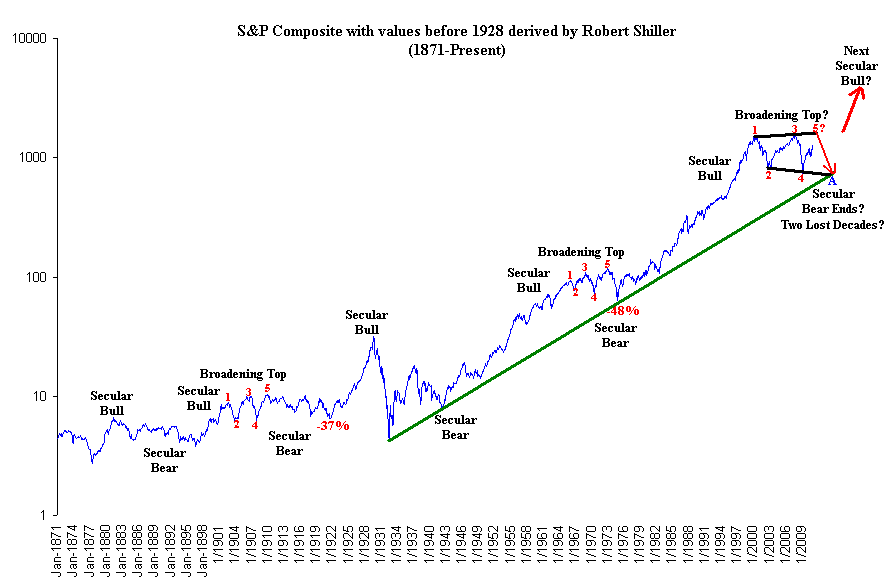
Signup for a "Free 4 Week Trial Membership" or save
up to 50% on a Premium Membership and you will have access to the following
products.
1. "ETF Daily Buy and Short Signals"
which can be used to trade the DIA's, QQQQ's and SPY's.
2. "401K/Thrift Savings Plan (TSP) Timing
Service" which can be used to help improve your return in your 401k/TSP
Account.
3. The "End of Month Strategy".
This Strategy focuses on the typical End of Month markup by the Institutional
Money.
4. "Stocks to Buy List" which can be
used with either our Short Term Strategy or Long Term Strategy.
Our Winter Membership Special for
new Members is shown below
which are 50% Off our normal Monthly Rate of $39.95
|
Membership Plans
|
Initial 50% Off
Introductory Rate
|
|
30 Day Trial Membership
|
FREE |
| Monthly Membership |
$19.95 |
| 6 Month Membership |
$119.95 |
All Trial and Regular
Memberships are on a renewal basis so please email
us to cancel your Membership before it
renews as they "aren't refundable".
After the Introductory Period expires Memberships
will automatically renew at our normal Monthly Discounted Rate of $21.95.
Send this Free Newsletter to a Friend or Relative
Amateur Investors
|


