|
(1/10/09)
The market pulled back this week after becoming rather overbought as it remains in the 4th Wave up in association with a longer term Elliott 5 Wave pattern as I have discussed before.
For those that follow Elliott Wave patterns the 4th Wave by definition typically will not retrace more than 38.2% of the move from the peak of Wave 2 to the bottom of Wave 3.
In addition volume is usually much less than what occurs with Wave 3. A daily chart of the Dow shows the current Waves and notice overall volume has been dropping off considerably as the corrective 4th Wave up has continued.
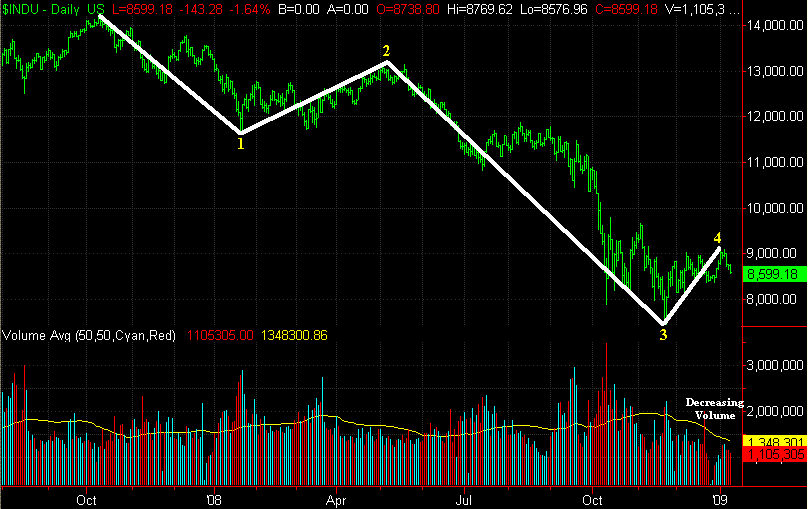
Keep in mind based on Elliott Wave Theory once the 4th Wave ends
this should be followed by the final 5th Wave down as shown in the illustration
below. Once the overall 5 Wave pattern completes
itself then this would be followed by an "ABC" type rally. 
Meanwhile if we take a look at a weekly chart of the
Dow notice the 38.2% Retracement Level calculated from the peak of Wave 2 to the bottom of Wave 3 is near the 9600 level so if the 4th Wave continues then the Dow may not get above this level or its 20 Week EMA (green line) near 9350. 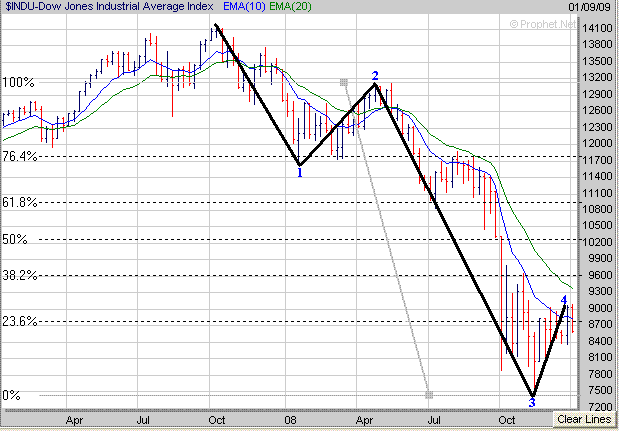
Next if we look at the Nasdaq it’s exhibiting a corrective 4th Wave up as well with its 38.2% Retracement calculated from the peak of Wave 2 to the bottom of Wave 3 near
1775 which is also close to its 20 Week EMA (green line). Thus if Wave 4 does continue the Nasdaq may not rise above the 1750-1775 area. 
As far as the S&P 500 its 38.2% Retracement Level calculated from the peak of Wave 2 to the bottom of Wave 3 is at 1008 while its 20 Week EMA (green line) has dropped to around 990.
Thus I would expect Wave 4 not to exceed the 990 to 1008 area if it continues
higher the rest of this month. 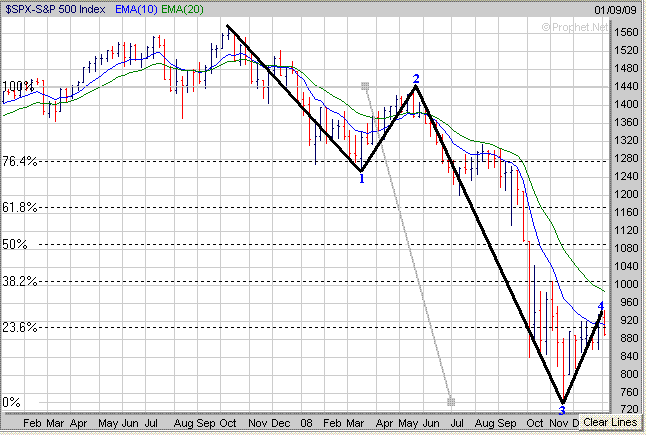
Meanwhile as far as the near term the Dow has a key support level near
8470 which is along its upward trend line (black line) and 38.2% Retracement Level calculated from the 11/21 low to the most recent high.
This will be a key support level to watch next week. If the Dow holds support at or above
8470 then we could eventually see another move higher develop. However if the Dow were to break below
8470 then I would expect a drop back to either its 50% Retracement Level near 8275 or its 61.8% Retracement Level near 8100. 
The Nasdaq
has a key short term support level near 1525 which is along its upward trend line (black line) and 38.2% Retracement Level calculated from the 11/21 low to its most recent high.
If the Nasdaq can hold support at or above 1525 then this could be followed by another move higher.
Meanwhile if the Nasdaq were to break below 1525 then the next area of support would either be at its 50% Retracement Level near
1480 or at its 61.8% Retracement Level near 1440. 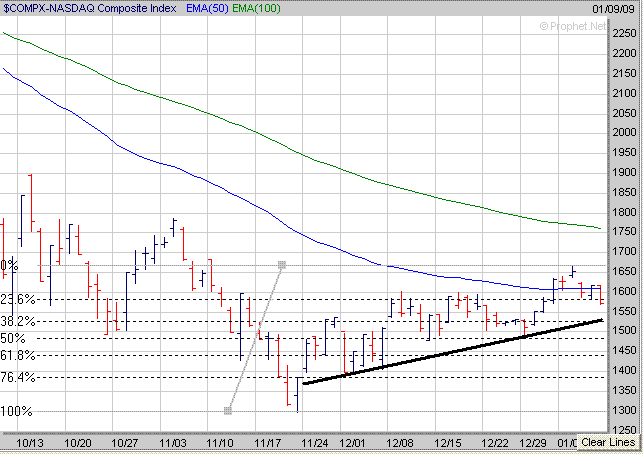
Finally for the S&P 500 it has a key support area in the 880 to 866 range. The 880 level is along its upward trend line (black line) while the 866 level is the 38.2% Retracement Level calculated from the 11/21 low to the most recent high. If the S&P 500 can hold support at or above the 866 level then we could see another move higher. However if the S&P 500 were to break below 866 then look for the next area of support either at its 50% Retracement Level near
842 or at its 61.8% Retracement Level around 818. 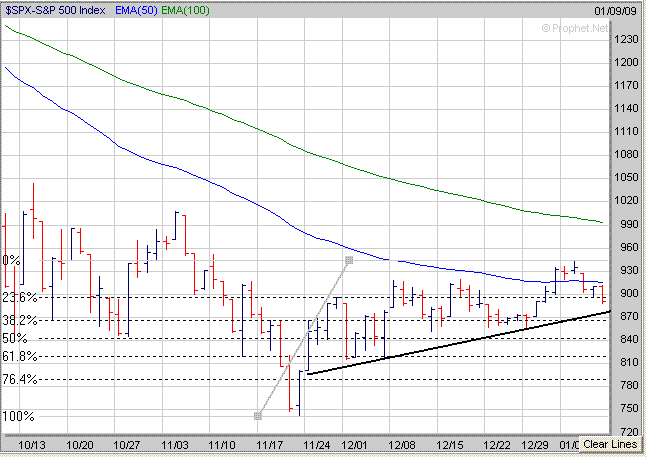
In 2008 our ETF Strategies worked the best with
which had a return of +33% versus the S&P 500 which was down -38.5% for the year.
Meanwhile our 401K Strategy finished up +17.3% for
the year.
Signup for a "Free 4 Week Trial Membership" or save
up to 50% on a Premium Membership and you will have access to these Investment
Products which include the following:
1. "ETF Daily Buy and Short Signals" which can be used to trade the
DIA's, QQQQ's, SPY's and OIH's. Our ETF
Strategy returned 33% in 2008.
2. "401K/Thrift Savings Plan (TSP) Timing Service" which can be
used to help improve your return in your 401k/TSP Account which was up +17.3% in
2008.
3. The "End of Month Strategy"
finished up +36.3% in 2008. This Strategy focuses on the typical End of
Month markup by the Institutional Money.
4. "Stocks to Buy List" which can be used with either our Short
Term Strategy or Long Term Strategy. In 2007 our Long Term Strategy
finished even for the year versus the S&P 500 which was down -38.5%.
Our Winter Membership Special for
new Members is shown below
which are 50% Off our normal Monthly Rate of $39.95
|
Membership Plans
|
Initial 50% Off
Introductory Rate
|
|
30 Day Trial Membership
|
FREE |
| Monthly Membership |
$19.95 |
| 6 Month Membership |
$119.95 |
All Trial and Regular
Memberships are on a renewal basis so please email
us to cancel your Membership before it
renews as they "aren't refundable".
After the Introductory Period expires Memberships
will automatically renew at our normal Monthly Discounted Rate of $21.95.
Send this Free Newsletter to a Friend or Relative
Amateur Investors
|

