|
(2/9/13)
As you know January had it's best performance since 1997 as it
finished up 5% for the month. Historically there have only been 21
occurrences since 1871 in which the S&P has had a January Return of 5% or
more. Meanwhile there are bold predictions from analysts that within
3 to 5 years the Dow will reach 20,000 and the S&P 500 well over
2,000. The reason for these bold predictions is that since 1950
when the S&P has finished with a gain of 5% or more in January the average
return for the year has been 24% while the average 5 year return has been
around 60%. Notice since 1950 there has never been a negative
return on a yearly or 5 year basis when January has risen 5% or more so this is
why there are numerous bold predictions that the next great Secular Bull Market
has arrived.
However before 1950 there were several years in
which the S&P returned 5% or more in January but ended up with a negative
yearly return or even a negative 5 year return. This is why the bullish
analysts never talk about anything before 1950 since things didn't always work
out as well. Thus you can clearly see the market has enjoyed the good life
since 1950.
| After
1950 |
January |
Yearly |
5 Year |
% from |
Shiller |
| Year |
Performance |
Performance |
Return |
4 Year Low |
PE Ratio |
| 1/31/2013 |
5.0 |
? |
? |
127 |
22.7 |
| 1/31/1997 |
6.1 |
31.0 |
46.0 |
86 |
28.3 |
| 1/31/1989 |
7.1 |
27.3 |
56.8 |
82 |
15.1 |
| 1/30/1987 |
13.2 |
2.0 |
52.2 |
102 |
14.9 |
| 1/31/1985 |
7.4 |
26.3 |
96.7 |
76 |
10.0 |
| 1/31/1980 |
5.8 |
25.8 |
46.5 |
35 |
8.9 |
| 1/30/1976 |
11.8 |
19.1 |
34.6 |
67 |
11.2 |
| 1/31/1975 |
12.3 |
31.5 |
40.2 |
29 |
8.9 |
| 1/31/1967 |
7.8 |
20.1 |
17.8 |
41 |
20.4 |
| 1/31/1961 |
6.3 |
23.1 |
49.6 |
54 |
18.5 |
| 1/29/1954 |
5.1 |
45.0 |
111.6 |
57 |
12.0 |
| 1/31/1951 |
6.1 |
16.5 |
110.0 |
60 |
11.9 |
|
|
Avg: 24% |
Avg: 60% |
|
|
| Before
1950 |
|
|
|
|
|
| 1/31/1946 |
7.0 |
-11.9 |
9.9 |
152 |
15.6 |
| 1/29/1943 |
7.2 |
19.4 |
46.1 |
18 |
10.2 |
| 1/31/1936 |
6.6 |
27.9 |
-26.1 |
236 |
17.1 |
| 1/31/1934 |
10.6 |
-5.9 |
18.3 |
168 |
13.9 |
| 1/31/1930 |
6.2 |
-28.5 |
-58.3 |
87 |
22.3 |
| 1/31/1929 |
5.7 |
-11.9 |
-61.0 |
142 |
27.1 |
| 1/30/1914 |
5.3 |
-11.5 |
-3.0 |
62 |
11.6 |
| 1899-01-31 |
8.0 |
5.5 |
6.3 |
11 |
22.9 |
| 1894-01-31 |
5.8 |
-0.5 |
41.0 |
20 |
15.7 |
|
|
Avg: -2% |
Avg: -3% |
|
|
Meanwhile if we look at those events when the S&P was up at
least 5% in January, 100% or more above its 4 year low and had a Shiller PE of
17 or above there have only been three occurrences since 1871. The last
event occurred this January while the others were in January of 1936 and January
of 1929. Notice the 5 year return in these two previous events
were -26% and -61% respectively.
| After
1950 |
January |
Yearly |
5 Year |
% from |
Shiller |
| Year |
Performance |
Performance |
Return |
4 Year Low |
PE Ratio |
| 1/31/2013 |
5.0 |
? |
? |
127 |
22.7 |
| 1/31/1997 |
6.1 |
31.0 |
46.0 |
86 |
28.3 |
| 1/31/1989 |
7.1 |
27.3 |
56.8 |
82 |
15.1 |
| 1/30/1987 |
13.2 |
2.0 |
52.2 |
102 |
14.9 |
| 1/31/1985 |
7.4 |
26.3 |
96.7 |
76 |
10.0 |
| 1/31/1980 |
5.8 |
25.8 |
46.5 |
35 |
8.9 |
| 1/30/1976 |
11.8 |
19.1 |
34.6 |
67 |
11.2 |
| 1/31/1975 |
12.3 |
31.5 |
40.2 |
29 |
8.9 |
| 1/31/1967 |
7.8 |
20.1 |
17.8 |
41 |
20.4 |
| 1/31/1961 |
6.3 |
23.1 |
49.6 |
54 |
18.5 |
| 1/29/1954 |
5.1 |
45.0 |
111.6 |
57 |
12.0 |
| 1/31/1951 |
6.1 |
16.5 |
110.0 |
60 |
11.9 |
|
|
Avg: 24% |
Avg:
60% |
|
|
| Before
1950 |
|
|
|
|
|
| 1/31/1946 |
7.0 |
-11.9 |
9.9 |
152 |
15.6 |
| 1/29/1943 |
7.2 |
19.4 |
46.1 |
18 |
10.2 |
| 1/31/1936 |
6.6 |
27.9 |
-26.1 |
236 |
17.1 |
| 1/31/1934 |
10.6 |
-5.9 |
18.3 |
168 |
13.9 |
| 1/31/1930 |
6.2 |
-28.5 |
-58.3 |
87 |
22.3 |
| 1/31/1929 |
5.7 |
-11.9 |
-61.0 |
142 |
27.1 |
| 1/30/1914 |
5.3 |
-11.5 |
-3.0 |
62 |
11.6 |
| 1899-01-31 |
8.0 |
5.5 |
6.3 |
11 |
22.9 |
| 1894-01-31 |
5.8 |
-0.5 |
41.0 |
20 |
15.7 |
|
|
Avg: -2% |
Avg: -3% |
|
|
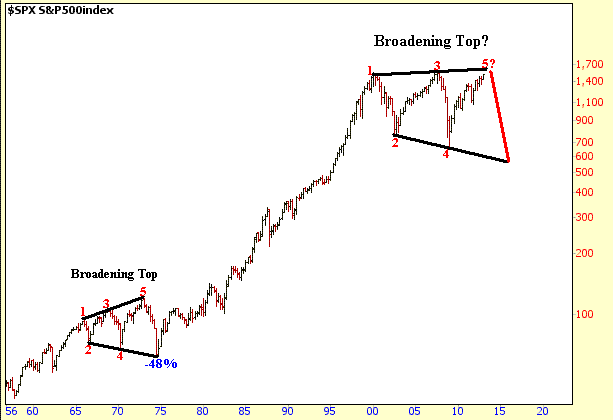
Finally we do need to be aware of the potential large Broadening
Top pattern developing in the S&P. Remember the S&P developed a
similar pattern from the mid 1960's through the early 1970's which was then
followed by a 48% sell off. If the S&P does eventually make a new all
time high this year above the 1576 level that sets up a rather large Broadening
Top pattern once again.
Signup for a "Free 4 Week Trial Membership" or save
up to 50% on a Premium Membership and you will have access to the following
products.
1. "ETF Daily Buy and Short Signals"
which can be used to trade the DIA's, QQQQ's and SPY's.
2. "401K/Thrift Savings Plan (TSP) Timing
Service" which can be used to help improve your return in your 401k/TSP
Account.
3. The "End of Month Strategy".
This Strategy focuses on the typical End of Month markup by the Institutional
Money.
4. "Stocks to Buy List" which can be
used with either our Short Term Strategy or Long Term Strategy.
Our Winter Membership Special for
new Members is shown below
which are 50% Off our normal Monthly Rate of $39.95
|
Membership Plans
|
Initial 50% Off
Introductory Rate
|
|
30 Day Trial Membership
|
FREE |
| Monthly Membership |
$19.95 |
| 6 Month Membership |
$119.95 |
All Trial and Regular
Memberships are on a renewal basis so please email
us to cancel your Membership before it
renews as they "aren't refundable".
After the Introductory Period expires Memberships
will automatically renew at our normal Monthly Discounted Rate of $21.95.
Send this Free Newsletter to a Friend or Relative
Amateur Investors
|

