|
(2/18/12)
Investors have been all excited since the development of a Gold
Cross Signal on January 31st. A "Golden Cross" occurs when
the 50 Day Moving Average crosses above the 200 Day Moving Average. Prior to
the current Golden Cross Signal there have been 26 occurrences since 1960 in which
"21" ended up with a positive return in the S&P 500 "6"
months later. The Average 6 Month Gain for all of the Signals was
7.4% with the largest gain back in 2009 when the S&P 500 rose just over 25%
from late June through late December. Also you can see the last
"9" Signals have all been followed by a positive return 6 months
later. 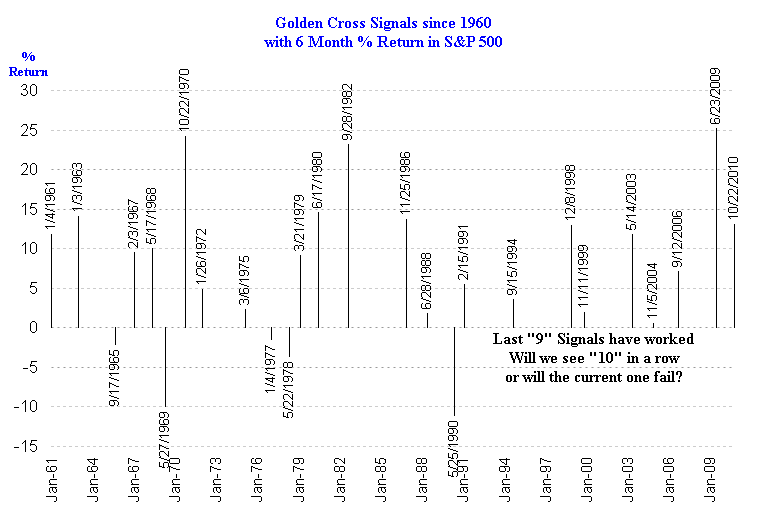
Meanwhile if we
look at all of the Golden Cross Signals going back to the late 1890's in the
S&P Composite you can see why some researchers don't mention the Signals
before 1960 as there were far more occurrences that ended up with a negative
return 6 months later. Prior to 1960 (highlighted in green) there were 44
Signals with "28" producing a positive gain after 6 months which
comes out to 64%. The average return on the 44 signals from 1897 to 1959
was only 3% as compared to the ones from 1960-2011 which averaged 7.7%. 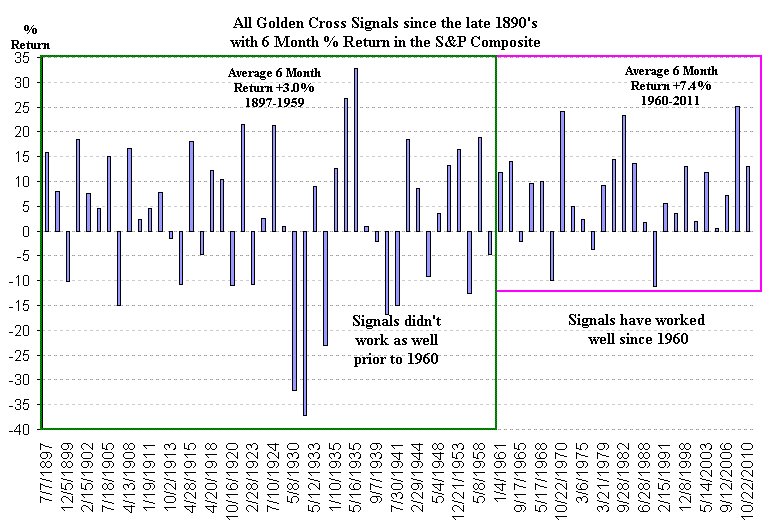
The table below
compares all of the Gold Cross Signals from the two periods mentioned above with
the Average Return 6 Months later in the S&P Composite. As you can see the Signals have been
more reliable since 1960 than before it with higher returns.
|
#
of |
#
of |
# of |
Average |
|
Signals |
Winners |
Losers |
Return |
| 1897-1959 |
44 |
28 (64%) |
16 (36%) |
3.0% |
| 1960-2011 |
26 |
21 (81%) |
5 (19%) |
7.4% |
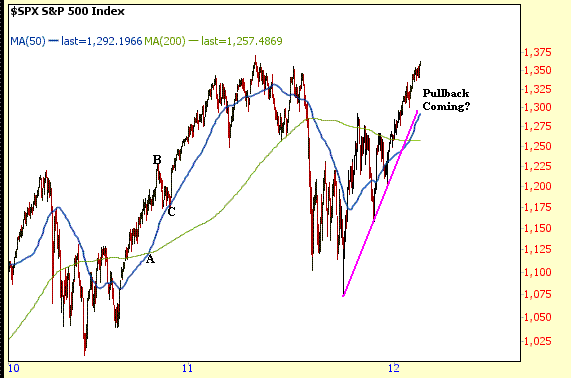
Finally keep in mind the last Golden Cross Signal back in
October of 2010 (point A) was followed by a pullback (points B to C) to its 50
Day Moving Average (blue line) before the S&P 500 continued higher. If
a similar scenario were to occur the 50 Day Moving Average is currently rising
up to around the 1300 level which is also close to the upward trend line from
last October's low (purple line).
Signup for a "Free 4 Week Trial Membership" or save
up to 50% on a Premium Membership and you will have access to the following
products.
1. "ETF Daily Buy and Short Signals"
which can be used to trade the DIA's, QQQQ's and SPY's.
2. "401K/Thrift Savings Plan (TSP) Timing
Service" which can be used to help improve your return in your 401k/TSP
Account.
3. The "End of Month Strategy".
This Strategy focuses on the typical End of Month markup by the Institutional
Money.
4. "Stocks to Buy List" which can be
used with either our Short Term Strategy or Long Term Strategy.
Our Winter Membership Special for
new Members is shown below
which are 50% Off our normal Monthly Rate of $39.95
|
Membership Plans
|
Initial 50% Off
Introductory Rate
|
|
30 Day Trial Membership
|
FREE |
| Monthly Membership |
$19.95 |
| 6 Month Membership |
$119.95 |
All Trial and Regular
Memberships are on a renewal basis so please email
us to cancel your Membership before it
renews as they "aren't refundable".
After the Introductory Period expires Memberships
will automatically renew at our normal Monthly Discounted Rate of $21.95.
Send this Free Newsletter to a Friend or Relative
Amateur Investors
|

