|
(12/15/12)
In the coming weeks I'm going to show a few indicators you can
use to time significant market bottoms which have worked very well in the
past. The first indicator I will talk about is the Zweig Breadth
Thrust (ZBT) developed by Martin Zweig back in the 1980's. This
indicator uses Advance Decline data from the NYSE and is calculated by taking a
10 Day EMA of the number of Advances/(number of Advances + number of
Declines). His research showed that within "10" trading days
if the ZBT dropped below 0.40 and then rose back above 0.615 then this triggered
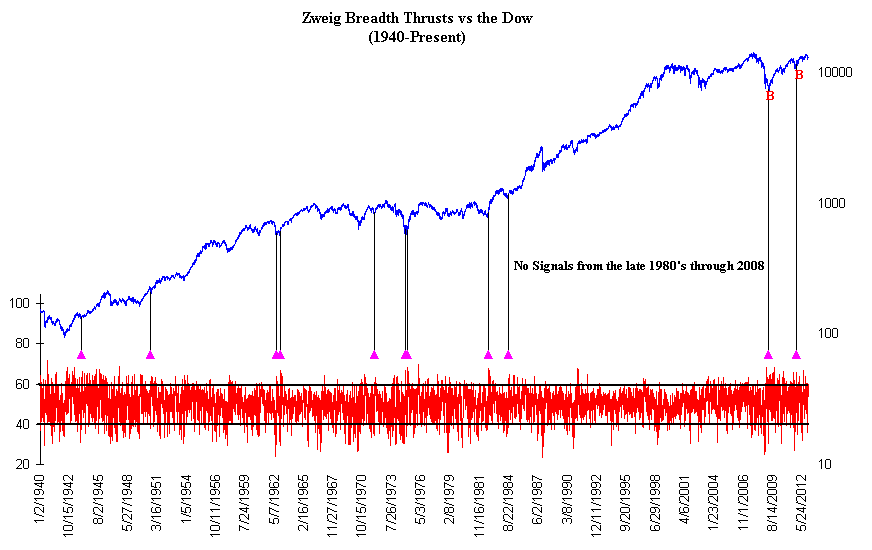
a long term Buy Signal. The chart below shows all of the ZBT's going
back to 1940 based on data from the Wall Street Journal.
As you can see a ZBT does not occur very often (defined by a
purple triangle) but when it does significant rallies have followed.
In fact the two most recent ZBT signals marked a significant market bottom in October of 2011 and
back in
March of 2009 (points B). Another thing that is interesting is that
there were no signals from the late 1980's through 2008. Before this time on average
roughly "1" ZBT signal occurred once every 10 years.

The table below shows all of the ZBT signal dates along with the
performance in the Dow over the next 6 and 12 months. Overall when a
ZBT has occurred the average 6 Month Return in the Dow has been 18% while the
average 12 Month Return has been 24.3%.
| ZBT
Signal |
Closing |
6 Month |
% |
12 Month |
% |
| Date |
Price |
Close |
Gain |
Close |
Gain |
| 12/8/1943 |
134.4 |
141.9 |
5.6 |
150.5 |
11.9 |
| 7/21/1950 |
207.7 |
246.8 |
18.8 |
253.7 |
22.2 |
| 7/11/1962 |
589.1 |
671.1 |
13.9 |
709.8 |
20.5 |
| 11/5/1962 |
610.5 |
718.1 |
17.6 |
749.2 |
22.7 |
| 12/3/1971 |
859.6 |
961.4 |
11.8 |
1023.9 |
19.1 |
| 10/10/1974 |
648.1 |
781.3 |
20.6 |
823.9 |
27.1 |
| 1/3/1975 |
634.5 |
871.8 |
37.4 |
858.7 |
35.3 |
| 8/20/1982 |
869.3 |
1092.8 |
25.7 |
1194.2 |
37.4 |
| 8/3/1984 |
1202.8 |
1277.7 |
6.2 |
1353.1 |
12.5 |
| 3/18/2009 |
7486.6 |
9820.2 |
31.2 |
10779.2 |
44.0 |
| 10/14/2011 |
11644.5 |
12849.6 |
10.3 |
13328.9 |
14.5 |
|
|
6 Month |
|
12 Month |
|
|
|
Avg: |
18.1 |
Avg: |
24.3 |
As you can see from the table above for those that spend the
time to track this indicator it can prove very profitable by enhancing the value
of your investments such as a 401K.
Signup for a "Free 4 Week Trial Membership" or save
up to 50% on a Premium Membership and you will have access to the following
products.
1. "ETF Daily Buy and Short Signals"
which can be used to trade the DIA's, QQQQ's and SPY's.
2. "401K/Thrift Savings Plan (TSP) Timing
Service" which can be used to help improve your return in your 401k/TSP
Account.
3. The "End of Month Strategy".
This Strategy focuses on the typical End of Month markup by the Institutional
Money.
4. "Stocks to Buy List" which can be
used with either our Short Term Strategy or Long Term Strategy.
Our Winter Membership Special for
new Members is shown below
which are 50% Off our normal Monthly Rate of $39.95
|
Membership Plans
|
Initial 50% Off
Introductory Rate
|
|
30 Day Trial Membership
|
FREE |
| Monthly Membership |
$19.95 |
| 6 Month Membership |
$119.95 |
All Trial and Regular
Memberships are on a renewal basis so please email
us to cancel your Membership before it
renews as they "aren't refundable".
After the Introductory Period expires Memberships
will automatically renew at our normal Monthly Discounted Rate of $21.95.
Send this Free Newsletter to a Friend or Relative
Amateur Investors
|


