|
(8/4/07)
The market was unable to sustain its brief bounce from oversold conditions and
continued lower for the third week in a row. The Dow despite losing nearly
900 points the last 3 weeks still remains above its 200 Day EMA (blue line) near
12800. The key thing to watch next week will be if the Dow can hold
support at the intra day low made on Wednesday near 13130 (point A). If the Dow is
able to hold support near 13130 then we could see an oversold bounce develop
with resistance occurring once again near the Dow's 50 Day EMA around
13500. Meanwhile if the Dow is unable to hold support near 13130 then the
next level of support would be at its 200 Day EMA just above 12800. 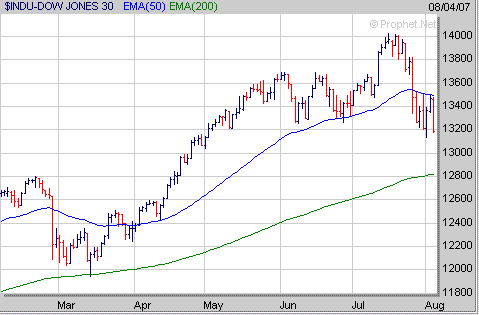
The
Nasdaq which has lost over 200 points the past 3 weeks is now nearing a key
support level at its 200 Day EMA (blue line) near 2492. If the Nasdaq can
hold support at its 200 Day EMA next week then we may see an oversold bounce
occur possibly back to the around its 50 Day EMA (red line) near 2600.
Meanwhile if the Nasdaq is unable to hold support at its 200 Day EMA then this
could eventually lead to a drop back to its March low near 2350 (point B) at
some point. 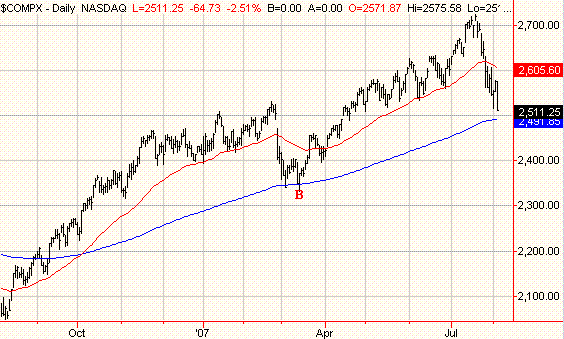
As far as the S&P 500 it has
fallen over 120 points the past 3 weeks and now has broken below its 40 Week EMA
(green line). As we have seen in the past since the late 2002 low each
time the S&P 500 has gone through a substantial correction it usually hasn't
found support at its 40 Weekly EMA except for last March (point C). In
fact the key longer term support area has been at or just above its 90 Week EMA
(points D). Although the S&P 500 has become very oversold in the
near term and could undergo a bounce it appears there is a good chance it may
eventually drop back to its 90 Week EMA near 1375 before we see a potential
bottom. 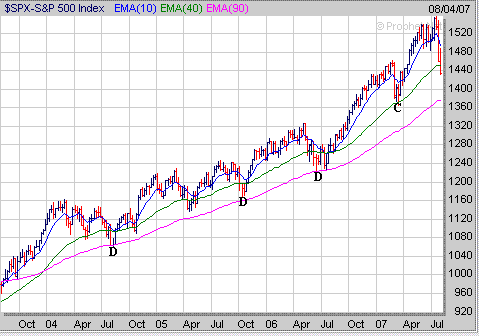
Meanwhile one disturbing thing
that occurred this week was the action in the Russell 2000 (RUT) as it has now
dropped back to a key longer term area in the 750 to 760 range which coincides
with its 90 Week EMA (green line) and upward trend line (brown line) originating
from the 2004 low. If the RUT is unable to hold support at or above the
750 level over the next week or two this could lead to a change in longer term
direction for the RUT which has been in an up trend since making a bottom in
late 2002. 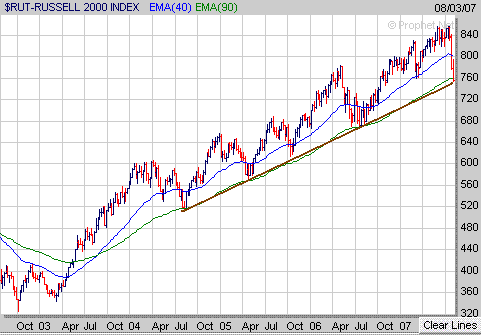
I expect
we are going to see more volatility in the market over the next several
weeks with big swings in both directions. Thus
your best opportunities will continue be in the Exchange Traded Funds (ETFs)
rather than individual stocks. For those that like to trade the ETFs I would encourage you to follow our Daily ETF signals which track the
DIA's, QQQQ's SPY's and OIH's.
Last week I featured an End of the Month Buy
Strategy to focus on and this week we will look at another Buy Strategy that has
worked well in the past regardless of what time of the month it is. This
Strategy uses the 2 Period RSI (Relative Strength Index) and a 5 Day
Stochastic. What I look for in this Strategy is for the 2 Period RSI to
have 3 days in a row below 65 with the last day below 10. In addition I
also want to see the 5 Day Stochastic below 20 as well.
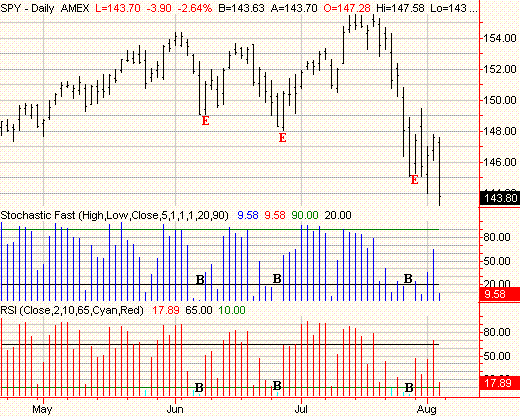
I will focus on the SPY and show the Buy
Signals that have been generated since May (points B) along with the entry days
(points E). Buy Signals were generated at the close on June 7th,
June 26th and again on July 27th with the entry days on June 8th, June 27th and
July 30th. In each of these cases the SPY gained over $2 or more within a
day or two.
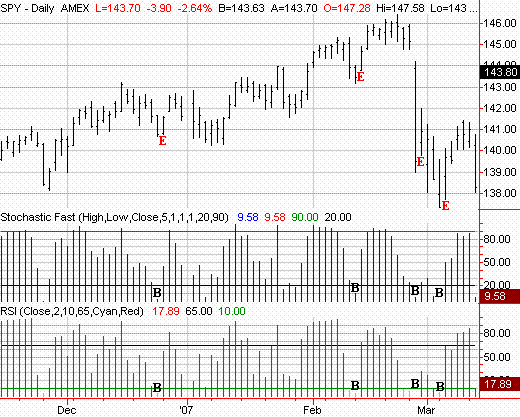
Meanwhile here are some more examples from
late 2006 into early 2007 with the Buy Signals (points B) and the entry days
(points E). In each of these cases the SPY gained from $1 to $2 within a
day or two.
Click
Here to Signup for your "Free 4 Week Trial Membership" and receive our
latest Daily ETF Buy and Sell Signals for next week. A
Trial Membership allows you to have access to these additional Products as well. Stocks
to Watch Buy List
401K/TSP Timing Signals
Industry Group Performance
Market Timing Indicator
Send this Free Newsletter to a Friend or Relative
Amateur Investors
|


