Charts (Sell Patterns)
When to sell a stock is a more difficult decision than buying a stock in my opinion. If you sell too early then you may miss a significant move upward and if you hold a stock too long, then it may drop all the way back down to what you purchased it for or even below that. Stocks have a tendency to drop more quickly than they rise. For example it may take several weeks for a stock to go from $50 to $100 but it may only take a few weeks or even less for it to drop from $100 back to $50. So as an investor you should pay close attention to what the charts look like when you decide to buy or sell a stock. Some chart patterns that warn me of a potential reversal include a Climax Top off a Parabolic Move, Double Top and the Head and Shoulders Top.
1. Climax Top Off a Parabolic Move
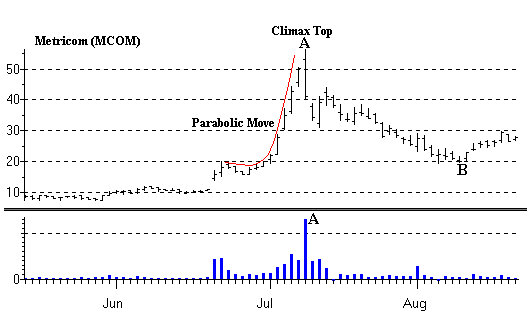
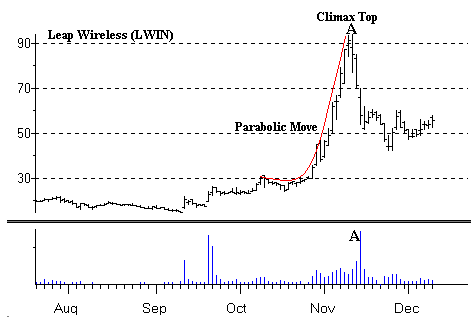
This pattern occurs when a stock rises very quickly out of a base and gets overextended. Stocks in a Parabolic Move can double or triple in value in a very short period of time (usually less than two weeks). As an investor you certainly don't want to be one of the last passengers on the train and get quickly thrown off. Some examples of this pattern are shown below.

Notice the quick move upward in MCOM back in July. In 5 trading days it went from $20 to $57 for a gain of 185%. Also notice that on the biggest volume day (point A) that it gapped up strongly to $53 and then closed poorly around $41. This was the Climax Top Off the Parabolic Move. As an investor you should have sold this day if you had bought the stock in the $20's. Meanwhile you certainly should have not bought this stock this day. Notice how the stock eventually pulled all the way back to $20 by early August (point B).

Another example of a Climax Top Off a Parabolic Move is demonstrated by LWIN. This stock skyrocketed from $30 to $95 in 10 trading days for a whopping gain of 217%. The Climax Top occurred on the 10th and 11th days of trading as the volume peaked (point A). The stock then sold off and retreated back quickly to around $42 by late November.
As you can see stocks that go up very quickly, in a Parabolic Move, can also come down just as fast. My advice is if you buy a stock and it doubles or triples in value in a very short period of time (1 to 2 weeks) take your profits and congratulate yourself for a job well done. If you become greedy then you could lose most of your gains as the above examples indicate. Furthermore if your buying a stock in this type of move be very careful and watch out for the Climax Top if the stock is trading on its biggest volume day.
The next type of chart topping pattern we will look at is the Double Top. Click on the link below for some examples.