|
(10/3/15)
Back in August a very rare event occurred in the market as the
following conditions were met.
1. Dow or S&P Composite dropped 10% in 5 Days or less.
2. Dow or S&P Composite were within 4 months of an "All Time
High"
3. Shiller PE was 20 or above
4. The 20 Month Moving Average was tested.
Since 1900 these conditions have only occurred "4"
other times (January of 2008, April of 2000, August of 1998 and October of
1929). Meanwhile when you add the additional parameter of the S&P 500
closing below its 20 Month MA for two months in a row this eliminates the 1998
event as the S&P 500 never closed below its 20 Month MA. So we
are left with "3" prior occurrences in early 2008, late 2000 and
way back in late 1929.
Let's look at these prior events and see what transpired.
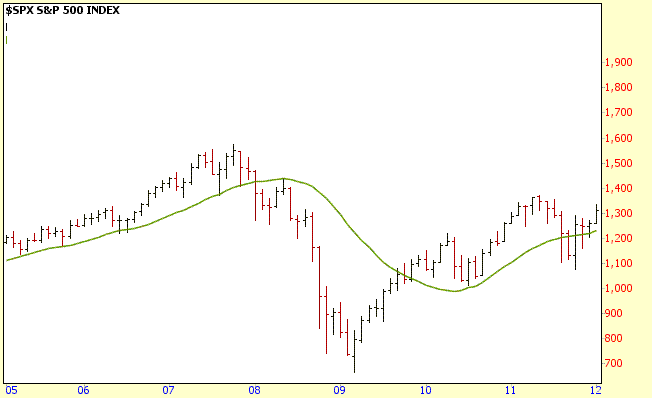
In early 2008 the S&P 500 closed two months in a row below its 20 Month MA
(green line). In this case it made a slightly lower low (point A) and then
rallied back to its 20 Month MA (points A to B) a few months later.
This was then followed by another major drop as the S&P 500 saw a 58%
correction from its October 2007 high of 1576 to the March 2009 low of 667.

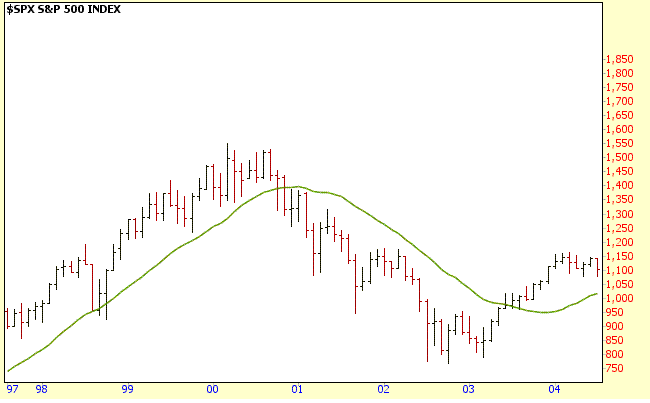
The next event was in late 2000 as the S&P 500 closed below
its 20 Month MA for two months in a row. In this case the S&P 500
continued to encounter resistance along its 20 Month MA for another few months
(points C) before trending lower again. Overall from the March 2000 high
of 1553 to the October 2002 low of 769 the S&P 500 lost 50% of its value.

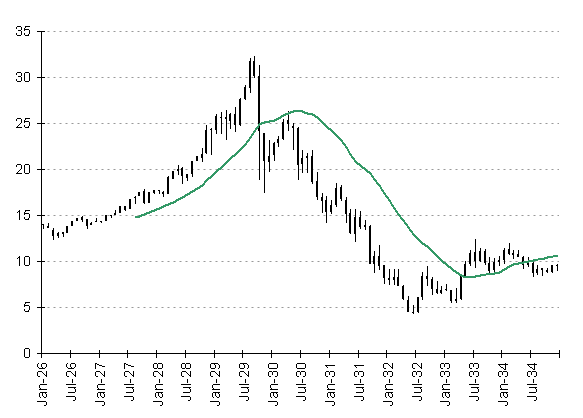
The last event was in late 1929 as the S&P 500 closed two
months in a row below its 20 Month MA. In this case the S&P 500
rallied back to its 20 Month MA over a 5 month period and then stalled out
(point D). This was then followed by another major drop as the S&P 500
lost 89% of its value from the 1929 high to the 1932 low.

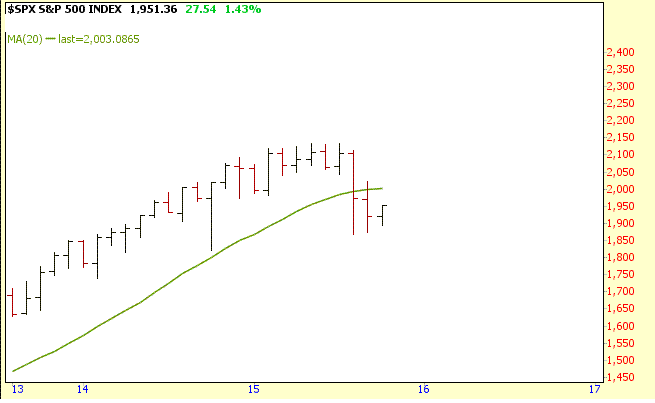
Overall as we have seen with the past three events a retest of
the 20 Month MA should be expected which is around the 2000
level.

Amateur Investors
|


