|
(10/25/14)
The sharp bounce from the low made on October 15th may lead to a
potential Breadth Thrust Buy Signal depending on how the market acts on Monday.
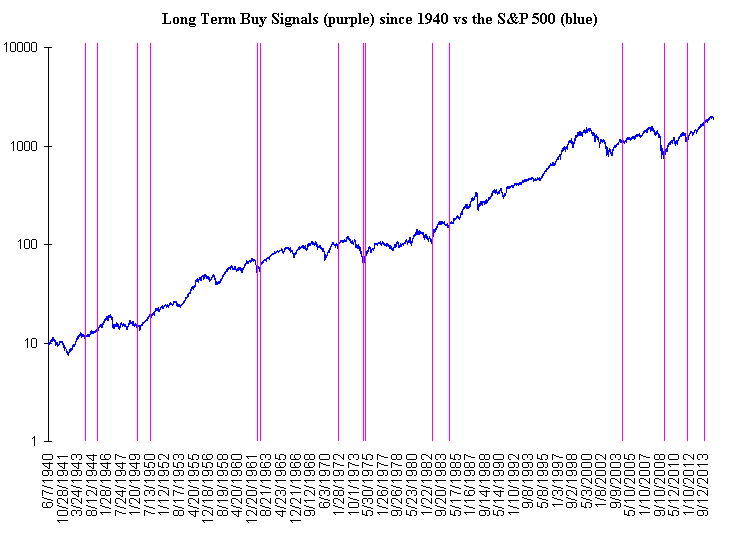
Previous Breadth Thrust Buy Signals are denoted by the purple lines below. As you can see
these Buy Signals have been relatively rare since World War 2 with only 15
Signals since the early 1940's. However since the 2009 low there have been
"3" of them (March of 2009, October of 2011 and October of 2013).

Finally as you can see from the table below the total returns in
the S&P 500 with the last two events have been gradually decreasing versus
the one that occurred in March of 2009. Thus even if a Buy Signal
was generated on Monday you really have to wonder if the total return in the
S&P 500 would be rather minimal based on current trends.
Long Term Buy Signals since 1940 with 6 Month and 12 Month
Performance in the S&P 500
| Signal |
# |
Closing |
6 Months |
6 Month |
12 Months |
12 Month |
| Date |
|
Price |
Later |
Return |
Later |
Return |
| 12/8/1943 |
1 |
11.50 |
12.25 |
6.5 |
13.09 |
13.8 |
| 2/3/1945 |
2 |
13.65 |
14.68 |
7.5 |
18.71 |
37.1 |
| 3/8/1949 |
3 |
14.89 |
15.41 |
3.5 |
17.19 |
15.4 |
| 7/21/1950 |
4 |
17.59 |
21.41 |
21.7 |
21.88 |
24.4 |
| 7/11/1962 |
5 |
57.73 |
64.85 |
12.3 |
69.75 |
20.8 |
| 11/5/1962 |
6 |
58.35 |
70.03 |
20.0 |
73.45 |
25.9 |
| 12/3/1971 |
7 |
97.06 |
109.73 |
13.1 |
119.10 |
22.7 |
| 10/10/1974 |
8 |
69.79 |
83.77 |
20.0 |
88.21 |
26.4 |
| 1/3/1975 |
9 |
70.71 |
94.36 |
33.4 |
90.90 |
28.6 |
| 8/20/1982 |
10 |
113.02 |
148.00 |
31.0 |
163.97 |
45.1 |
| 8/3/1984 |
11 |
162.35 |
178.63 |
10.0 |
191.48 |
17.9 |
| 5/24/2004 |
12 |
1095.41 |
1181.76 |
7.9 |
1194.07 |
9.0 |
| 3/18/2009 |
13 |
794.35 |
1068.30 |
34.5 |
1165.83 |
46.8 |
| 10/14/2011 |
14 |
1224.58 |
1370.26 |
11.9 |
1461.05 |
19.3 |
| 10/18/2013 |
15 |
1744.50 |
1864.85 |
6.9 |
1886.76 |
8.2 |
|
|
|
|
Avg:
16.0% |
|
Avg:
24.1% |
Amateur Investors
|


