|
(11/12/11)
Back in August there was a rare event in the Advance/Decline
numbers involving the NYSE. There were two days (8/4 and 8/8) in which the
number of Declining stocks exceeded the number of Advancing stocks by a ratio of
95:1. Meanwhile going back to 1930 there has only been a few events in
which the number of Declining stocks have exceeded the number of Advancing
stocks by a 95 to 1 ratio twice within 5 trading days. These events
happened in September of 1946, May of 1940 and April of 1937. Back
in September of 1946 (point A) the chart of the Dow shows it made a bottom in
October after losing 25% of its value from the April high. This was then
followed by a very choppy consolidation period from late 1946 through late 1949
before finally breaking out in the early 1950's. 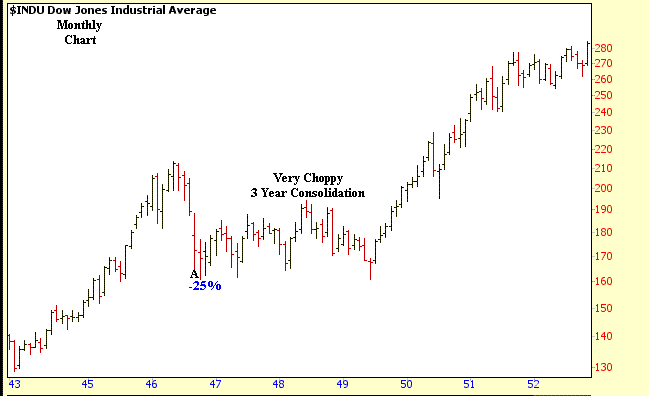
Meanwhile back in May of 1940 (point
B) the Dow bottomed in June after a 30% drop. This was followed by a 26%
rally over the next 5 months which was eventually followed by another leg lower
(-33%) from late 1940 through the early part of 1942 (points C to D) as World
War II was going on. 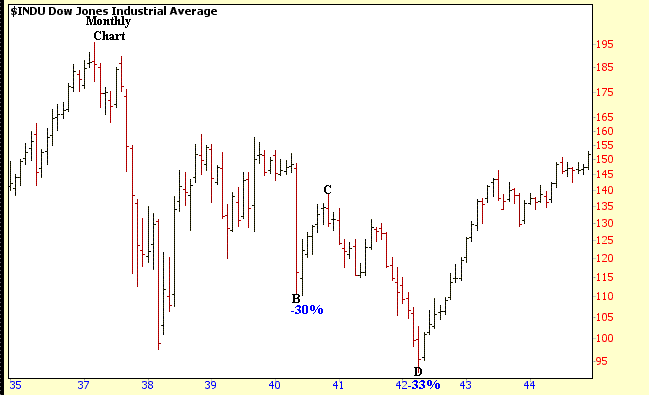
Finally going back to April of 1937
(point E) the Dow made a short term bottom in June after losing 17% of its value
from the early 1937 peak. This was then followed by a sharp 2 month
rally in which the Dow gained 16%. After this sharp 2 month rally the Dow
then sold off severely and lost 49% of its value by early 1938. 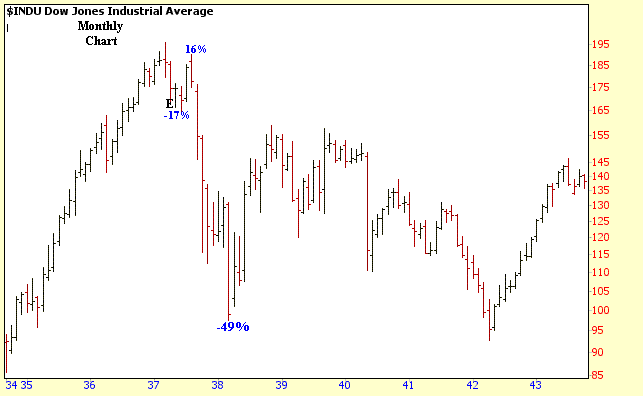
Furthermore notice the 5 Wave
affair down from the early 1937 high as well. 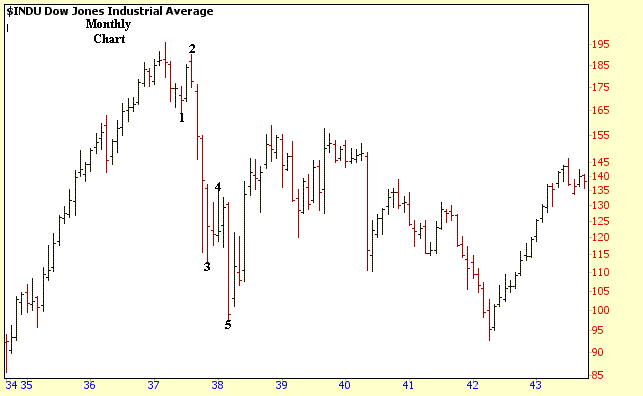 Now if we look at a current monthly
chart of the Dow so far it looks somewhat similar to the 1937 time
period. There was a 19% drop from May through September which was
followed by a sharp 18% rally in October. 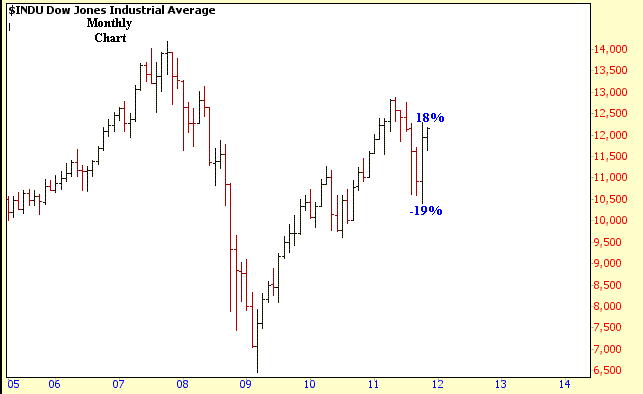
Now the question is could we see a
similar 5 Wave structure develop with an eventual retest of the previous March
2009 low or will a repeat of the mid to late 1940's occur where the Dow moved
nearly sideways exhibiting a very choppy consolidation period? 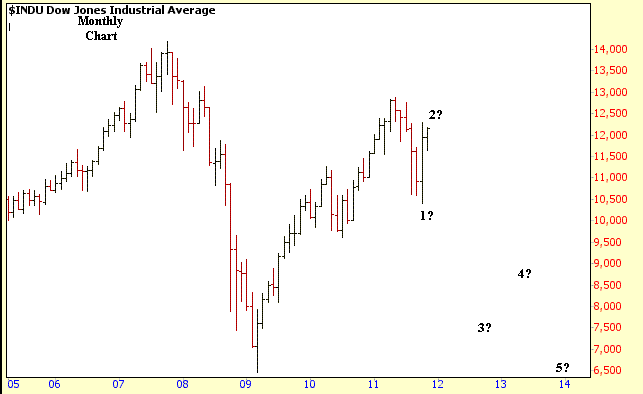
<
Amateur Investors
|


