|
Weekend Analysis
(5/6/06)
The Market
The Dow and S&P 500 made new 52 week highs this week as
there was some weakness in the price of Crude Oil. As we have seen in the
past when the price of Crude Oil has dropped (points A to B) this has allowed
for the Dow to rally (points C to D). The most recent correction in the
price of Crude Oil started in mid April (points E to F) which has coincided with
a rally in the Dow (points G to H). 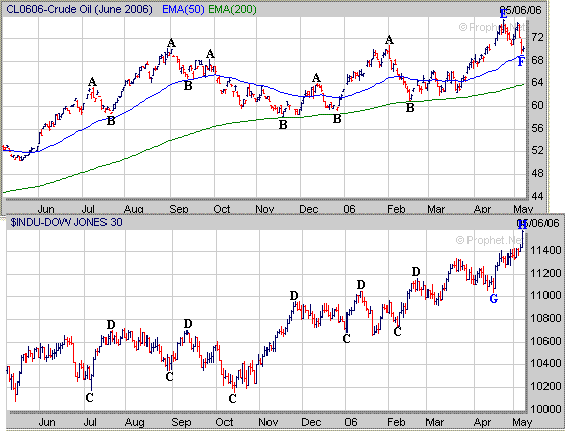
In the near term the price of Crude
Oil has a key support level at its 50 Day EMA (blue line) near the 69 level and
the question is will it hold support at this level or not in the days
ahead. At this time there are two possible scenarios for the price of
Crude Oil. If the price of Crude Oil fails to hold
support at its 50 Day EMA then it could eventually drop back to its 200 Day EMA
(green line) near 64 which would likely allow for the Dow to continue higher
much like we saw last February when the Crude Oil broke below its 50 Day EMA
(points I to J). Meanwhile the second scenario would be for the price of
Crude Oil to hold support at its 50 Day EMA which would then be followed by a
rally eventually leading to a new high much like occurred in July of 2005
(points K to L). In this case the
Dow topped out in July of 2005 and then came under some selling pressure (points K to L). 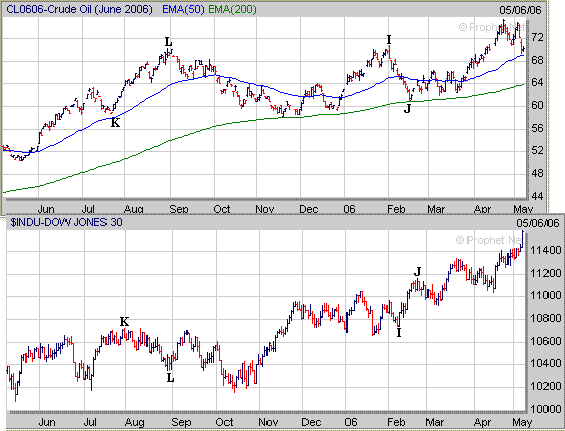
As far as the major averages the Dow
broke above a previous longer term resistance level this week near 10400 and now
is less than 200 points away from its all time high made in the early part of
2000 near 11750 (point M). As mentioned above if the price of Crude Oil
drops below its 50 Day EMA near 69 then this may allow for the Dow to reach its
all time high near 11750. 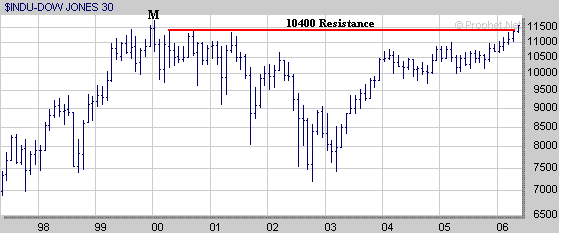
The Nasdaq held support this week at
its mid April low near 2300 and then began to rally on Thursday. If the
Nasdaq can follow through to the upside look for upside resistance near the 2375
level which is where it stalled out at twice in the month of April. 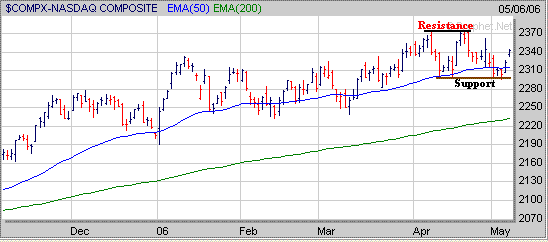
Meanwhile if we look at a longer
term chart of the Nasdaq on a logarithmic scale we can see that the 2375 level
is very close to the Nasdaq's 50% Retracement Level (calculated from the early
2000 high to the late 2002 low) so this might explain why it has been unable to
break above the 2375 level. Thus if the Nasdaq is able to rally back to
the 2375 level it will be interesting to see if it will stall out once again
near this level. 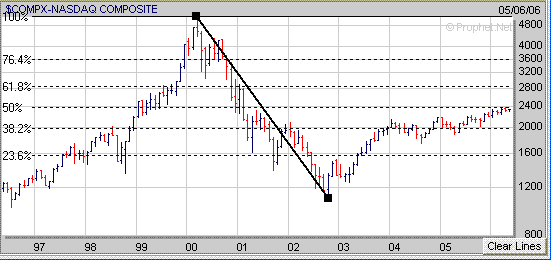
As
far as the S&P 500 it held support just over a week ago at its 50 Day EMA
(point N) and made a new 52 week high on Friday. 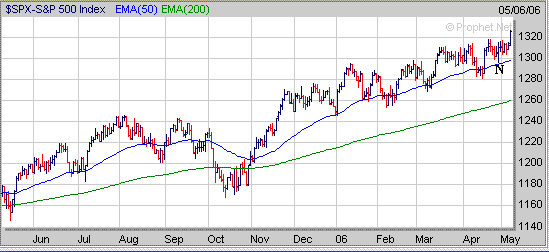
Meanwhile if the S&P 500 can
follow through to the upside its next area of upside resistance appears to be
around the 1360 level (point O) which coincides with its 76.4% Retracement Level
(calculated form the early 2000 high to the late 2002 low). 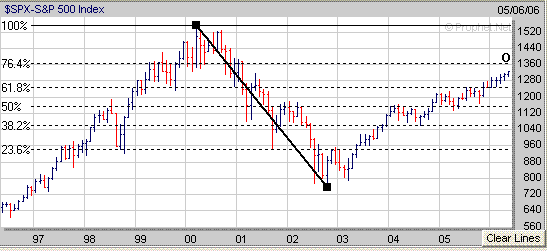
Stocks to Watch
(All charts are weekly unless denoted otherwise) Despite the Dow
and S&P 500 making new 52 week highs this week we still have a limited
number of stocks which are exhibiting a favorable chart pattern as most have
already broken out. A few stocks to watch include ARD which has
developed a small 3 week Handle (H) with its Pivot Point at $38.65. 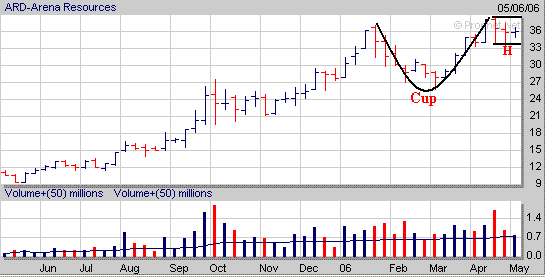
NMR
has developed a 5 week Flat Base (FB) with its Pivot Point at $23.40 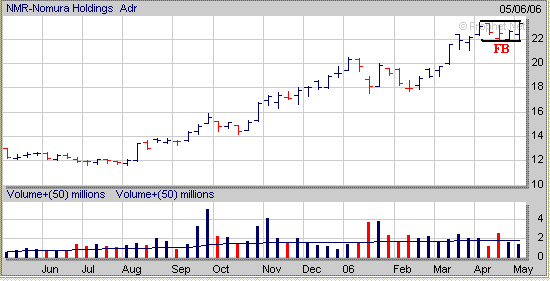
TISA has
developed a 7 week Handle (H) with its Pivot Point at $4.05. 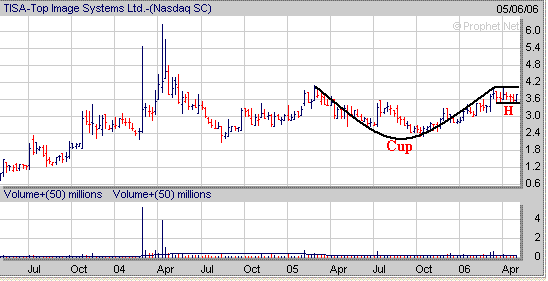
If you decide to take a position in any of these make sure they
reach their Pivot Points (Buy Price) first.
For those that have a limited amount of money to invest and can
only buy a few stocks the table below ranks the above stocks using the Amateur
Investor Index (AII) which includes several parameters such as Earnings
Strength, Relative Strength, Industry Group Strength,
Accumulation/Distribution and etc. Thus if you can only buy a few stocks
focus on the ones with the highest AAI Value in the table below.
Long Term Strategy
| Symbol |
AII |
Sector/ |
Chart |
Pivot |
Stop
Loss |
Average |
Initial |
| Value |
RS Strength |
Pattern |
Point |
Daily |
Target |
|
|
|
(Buy Price) |
Volume |
Price |
| ARD |
|
Oil
& Gas |
3
Month Cup |
$38.65 |
$35.00 |
202,000 |
$43 |
| 60 |
US
Exploration |
with
a |
|
74 |
3
Week Handle |
| NMR |
|
Financial |
5
Week |
$23.40 |
$21.40 |
389,000 |
$28 |
| 44 |
Investment
Brokers |
Flat
Base |
|
58 |
|
| TISA |
|
Computer |
1
Year Cup |
$4.05 |
$3.40 |
48,000 |
$6 |
| 23 |
Integrated
Systems |
with
a |
|
11 |
7
Week Handle |
Short Term Strategy
| Symbol |
AII |
Sector/ |
Chart |
Pivot |
Stop
Loss |
Average |
Initial |
| Value |
RS Strength |
Pattern |
Point |
Daily |
Target |
|
|
|
(Buy Price) |
Volume |
Price |
| ARD |
|
Oil
& Gas |
3
Month Cup |
$38.65 |
$37.65 |
202,000 |
$39.65 |
| 60 |
US
Exploration |
with
a |
|
74 |
3
Week Handle |
| NMR |
|
Financial |
5
Week |
$23.40 |
$22.40 |
389,000 |
$24.40 |
| 44 |
Investment
Brokers |
Flat
Base |
|
58 |
|
| TISA |
|
Computer |
1
Year Cup |
$4.05 |
$3.40 |
48,000 |
$5.05 |
| 23 |
Integrated
Systems |
with
a |
|
11 |
7
Week Handle |
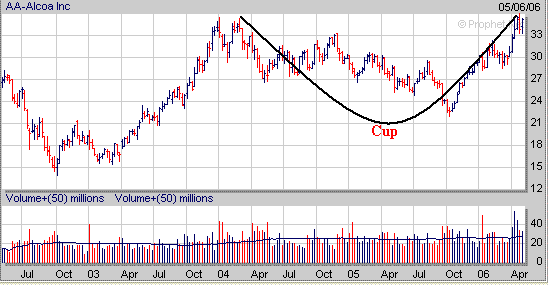
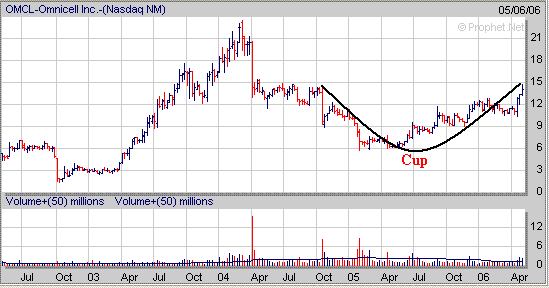
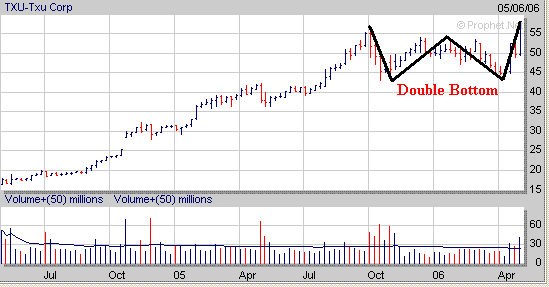
Meanwhile some stocks which have formed a Cup or Double Bottom
pattern but need to work on developing a Handle include AA
OMCL
OPNT
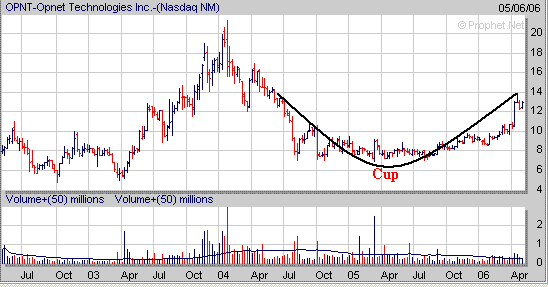
SII
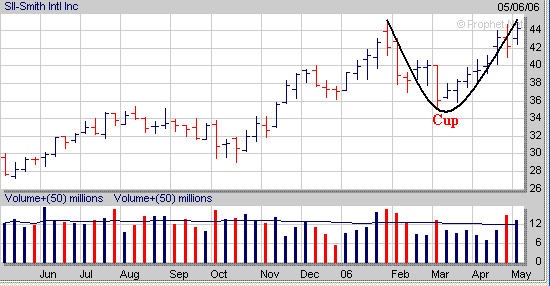
STXN
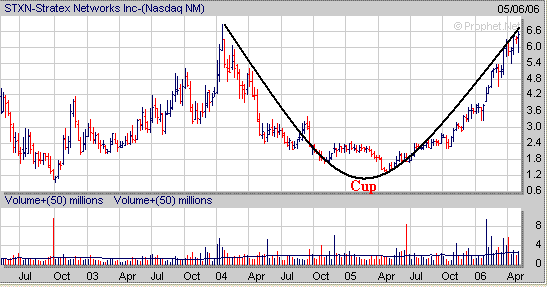
SWB
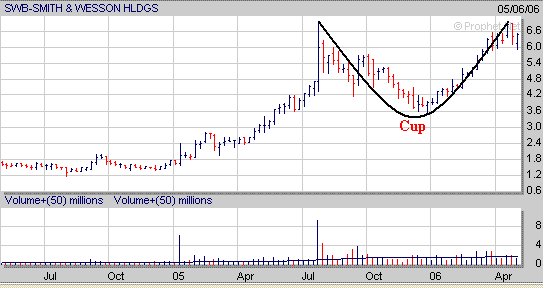
TXU
| Stock Deleted
from AII Top 100 |
Stocks Added to
AII Top 100 |
| CLRK, ECLP, GILD,
HOLX, IED, KAMN, LPSN, PDLI, VTAL |
ABX, ESV, FCS, GFI,
OMCL, NXG, SII, TXU, XPRSA |
Amateur Investors
|

