|
(3/4/17)
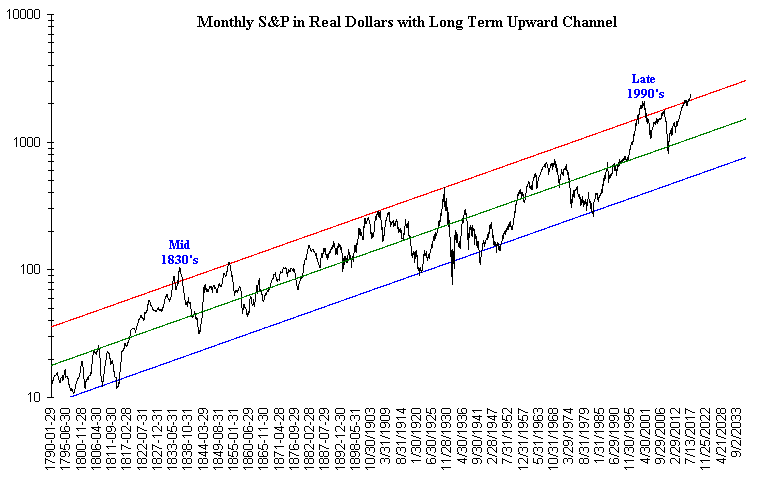
The S&P in Real Dollars is now above the top of its longer
term upward channel. There have only been two other occurrences in which
the S&P has been this far above the top of its upward channel.
The last event was in the late 1990's and the other way back in the mid
1830's.

If the S&P 500 were to rise another 10%, or roughly 250
points from current levels, it would then be equal to the peaks of 1999 and
1835. Right now the so called expert analysts on Wall Street are trying to
convince everyone that the market isn't overvalued. However this chart
suggests the market is extremely overvalued.
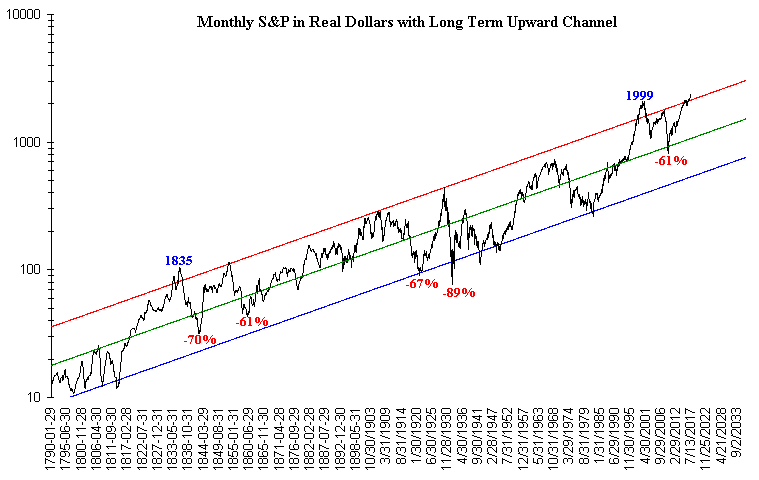
Meanwhile, as I have pointed out before, each time the S&P
has risen back to or above the top of its longer term upward channel substantial
corrections have eventually followed. All of these corrections were 60% or
more.

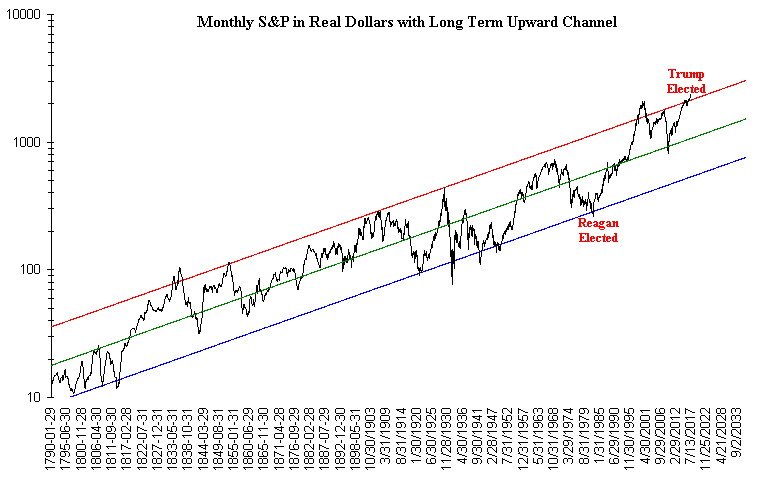
Finally another thing being floated by Wall street is that the
market is going to act like the Reagan years. When Reagan got elected the
S&P was severely undervalued and at the bottom of its longer term upward
channel. Meanwhile Trump has entered office with the S&P above the top
of its upward channel.

Amateur Investors
|


