|
(3/31/12)
I thought I would do a follow up on last Weekends' Report since
some have asked me to repost it and others probably didn't read it. As
some of you know from the early 1960's through 2011 there
have only been "5" occurrences when the following conditions have been
met. 1. The S&P 500 has closed "5"
consecutive days in a row above its +2.0 Bollinger Band.
2. The Yield on the 10 Year Bond is higher than it was 6 months ago.
3. The Rate on the 90 Day TBILL is higher than it was 6 months ago. Recently
we had another occurrence last week on March 19th as the S&P 500 closed
above its +2.0 Bollinger Band "5" trading days in a row. In
addition both the 90 Day TBILL and 10 Year Yield are higher now than they were 6
months ago as well (points A). 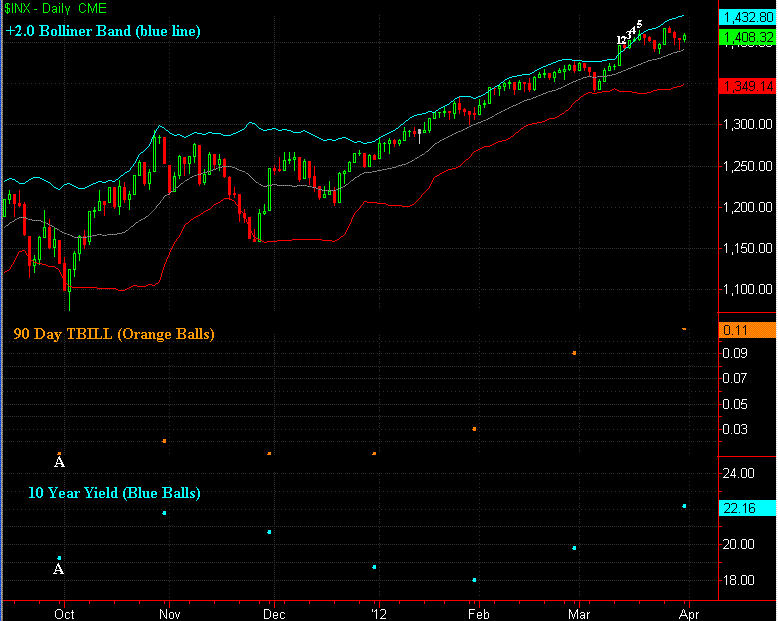
The
table below shows the dates of when all of the conditions mentioned above have
occurred in the past. As you can see the last occurrence prior to the most recent one
on March 19th happened way back in August of 1987.
| 5 Days |
90 Day TBILL |
10 Year Yield |
| Above +2.0 |
Higher than |
Higher than |
| Bollinger Band |
6 Months Ago |
6 Months Ago |
| 3/19/2012 |
Y |
Y |
| 8/12/1987 |
Y |
Y |
| 11/18/1980 |
Y |
Y |
| 9/26/1973 |
Y |
Y |
| 5/5/1969 |
Y |
Y |
| 11/9/1961 |
Y |
Y |
Meanwhile if we look at the prior occurrences, along with the performance in
the S&P 500 and the Dow over the next year, the market has trended strongly in one
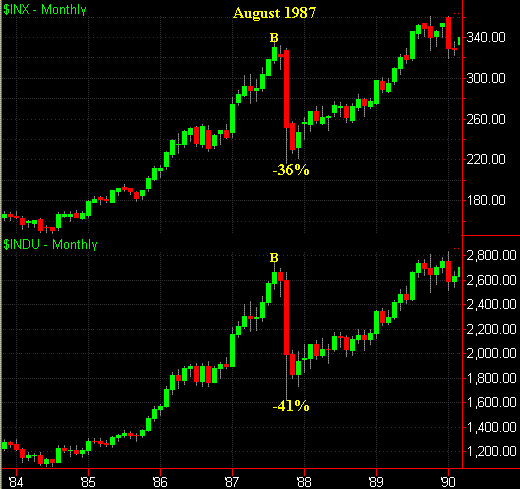
direction. As mentioned above the last event occurred in August of 1987 as
both the
S&P 500 and Dow peaked in August (points B). This was then followed by the
1987 crash in which the S&P 500 lost 36% of its value and the Dow 41% during the next 2
months.
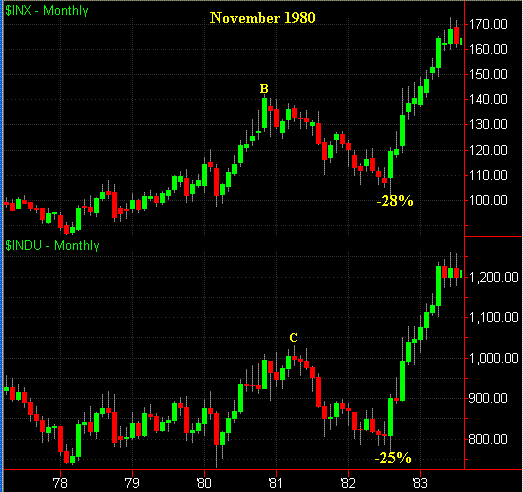
The next occurrence was back in November of 1980 as the S&P
500 peaked in November (point B) while the Dow was able to trend slightly higher
(just over 2%) through April of 1981 (point C). This was then followed by a 28%
correction during the next 21 months in the S&P 500 while the Dow lost 25%.
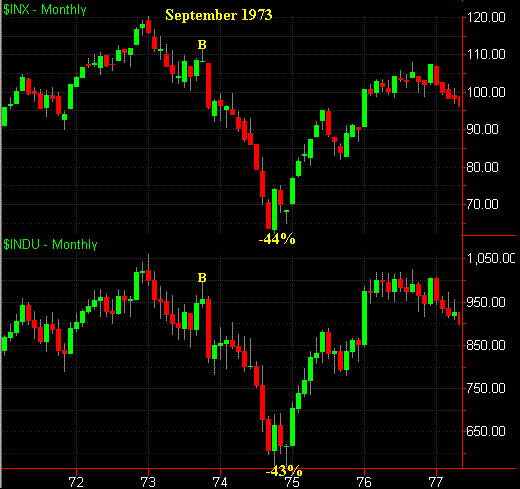
Meanwhile the next event occurred in September of 1973 as both the S&P 500
and Dow peaked a month later in October (points B). This was then followed by a 44% correction
in the S&P 500 and a 43% drop in the Dow during the next 11 months.
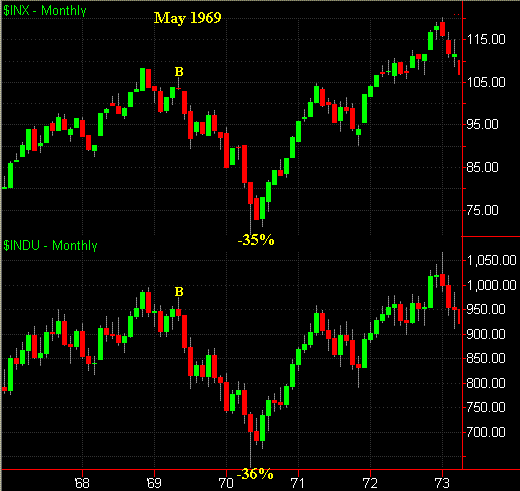
The next event was in May of 1969 as both the S&P
500 and Dow peaked in May (points B). This was then followed by a 35% correction
in the S&P 500 during
the next 18 months and a 36% correction in the Dow.
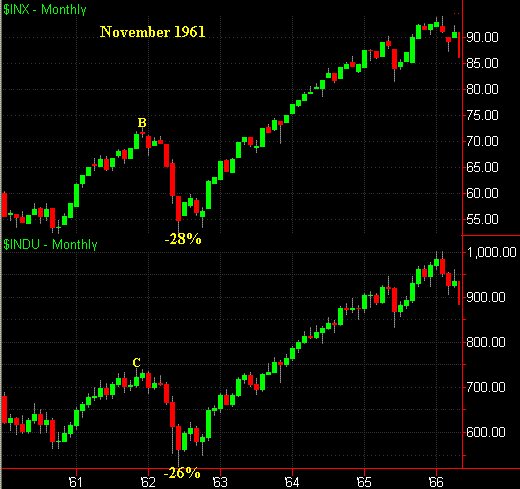
Finally the last occurrence was in November of 1961 as the S&P 500
peaked the following month in December (point B) while the Dow peaked in
November (point C). This was then followed by a 28% correction
over the next 6 months in the S&P 500 and a 26% correction in the Dow.
Thus the last "5" events saw the S&P 500 and the
Dow peak
either in the same month or the following month in all events except for the
November 1980 event in which the Dow peaked 5 months later in April of 1981. The corrections
that followed ranged from 28% to 44% in the S&P 500 and from 25% to
43% in the Dow. Like any research does that mean it's a 100%
certainty that a significant correction will take place over the next 12
months? The answer to that question is no, however, at least since the
early 1960's the odds certainly do favor one developing.
Amateur Investors
|


