|
(3/24/12)
A rather rare event occurred on Monday (March 19th) as the S&P 500 closed
above its +2.0 Bollinger Band for the 5th Day in a row. Since 1961 the
S&P 500 has only closed 5 consecutive days or more above its +2.0 Bollinger
Band "23" times. The last time the S&P 500 closed above its
+2.0 Bollinger Band "5" days in a row was back in early June of
2003. Of course many will ask what's the big deal? 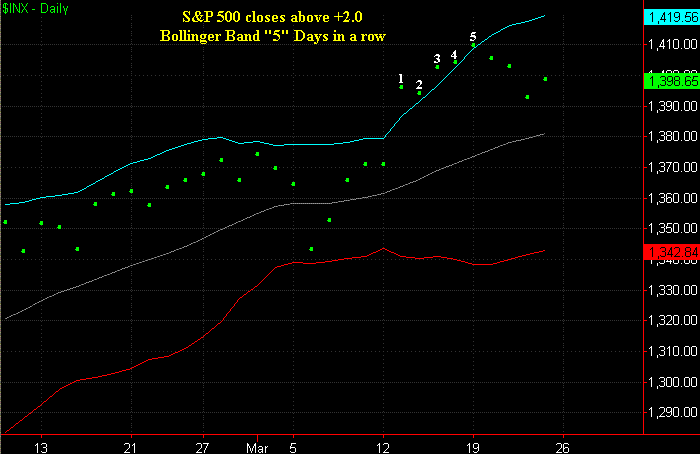
By itself closing 5
Days in a row above the +2.0 Bollinger Band has produced mixed results in the
S&P 500 over the next 6 to 12 months. However when you add these two
additional conditions things are skewed strongly in one direction: 1.
The rate in the 90 Day TBILL is higher than it was 6 months ago.
2. The Yield in the 10 Year Bond is higher than it was 6 months ago. The
table below shows all of the times the S&P 500 has closed 5 Days in a row
above its +2.0 Bollinger Band. In addition I have denoted whether the 90
Day TBILL Rate and 10 Year Bond Yield were higher than 6 months earlier as
well. As a result there have only been "5" previous events
(highlighted in blue) when the S&P 500 has closed above its +2.0 Bollinger
Band "5" Days in a row, the rate on the 90 Day TBILL was higher
than 6 months ago and the Yield on the 10 Year Bond was higher than 6 months
earlier.
| 5
Days |
90 Day
TBILL |
10 Year
Yield |
| Above
+2.0 |
Higher than |
Higher than |
| Bollinger
Band |
6 Months
Ago |
6 Months
Ago |
| 11/9/1961 |
Y |
Y |
| 11/20/1964 |
Y |
N |
| 5/5/1969 |
Y |
Y |
| 12/3/1970 |
N |
N |
| 4/14/1971 |
N |
N |
| 3/6/1972 |
N |
N |
| 9/26/1973 |
Y |
Y |
| 1/9/1976 |
N |
N |
| 11/18/1980 |
Y |
Y |
| 8/26/1982 |
N |
N |
| 10/12/1982 |
N |
N |
| 4/18/1983 |
Y |
N |
| 8/15/1986 |
N |
N |
| 8/12/1987 |
Y |
Y |
| 5/18/1989 |
Y |
N |
| 10/9/1989 |
N |
N |
| 12/27/1991 |
N |
N |
| 8/20/1993 |
Y |
N |
| 9/8/1995 |
N |
N |
| 11/11/1996 |
N |
N |
| 6/12/1997 |
N |
Y |
| 6/5/2003 |
N |
N |
| 3/19/2012 |
Y |
Y |
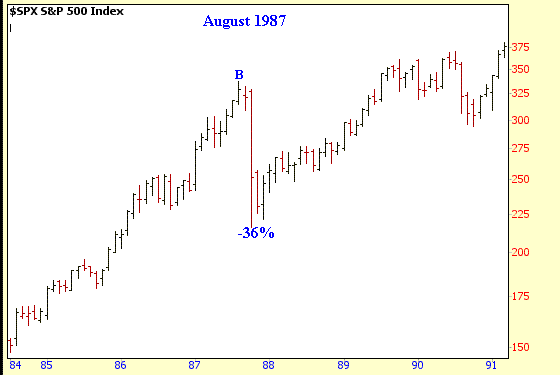
Now let's look at what happened with these previous
"5" events. The last event occurred in August of 1987 as the
S&P 500 peaked in August (points B). This was then followed by the
1987 crash in which it lost 36% of its value in 2 months.
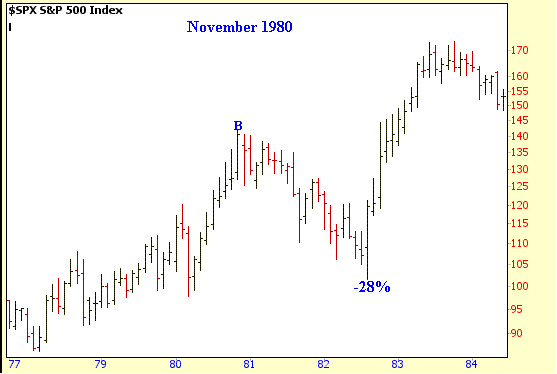
The next occurrence was back in November of 1980 as the S&P
500 peaked in November (point B). This was then followed by a 28%
correction during the next 21 months.
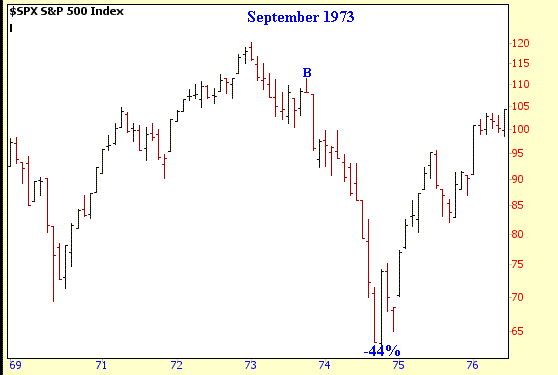
The next event occurred in September of 1973 as the S&P 500
peaked in October (point B). This was then followed by a 44% correction
during the next 11 months.
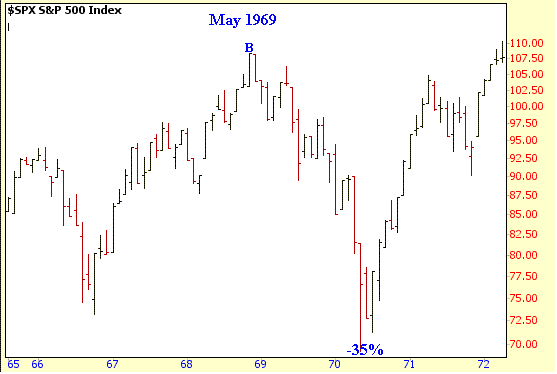
Meanwhile the next event occurred in May of 1969 as the S&P
500 peaked in May (point B). This was followed by a 35% correction during
the next 18 months.
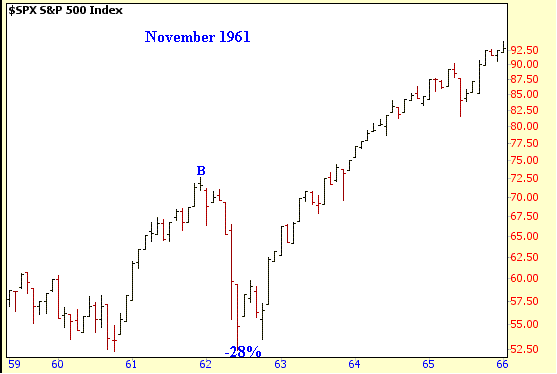
Finally the last case was in November of 1961 as the S&P 500
peaked in December (point B). This was then followed by a 28% correction
over the next 6 months.
Thus to summarize the last 5 events where characterized by tops
occurring within a month after these three parameters were met:
1. S&P 500 closed above its +2.0 Bollinger Band
"5" consecutive days in a row.
2.
The rate in the 90 Day TBILL was higher than it was 6 months ago.
3. The Yield in the 10 Year Bond was higher than it was 6 months ago.
All of these events were followed by corrections ranging from 28% to
44%. So either history is going to be rewritten or a substantial
correction is going to develop in the months ahead.
Amateur Investors
|

