|
(3/17/12)
The Dow has rallied 105% in 3 years since the March 2009 low and
is only 6% off its previous all time high of 14198.
Meanwhile its chart pattern looks similar to two other time periods going back
to 1896. 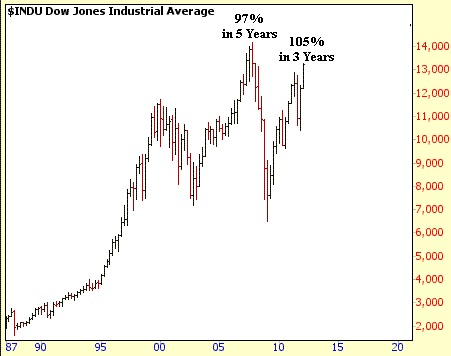
The first period is
from the early 1900's where the Dow gained 97% after bottoming in 1907. In
this case it got within 3% of its previous high made in 1906 (point A) before
peaking. This was then followed by an extended correction as it eventually retested
the 1907
low by 1914 (point B). 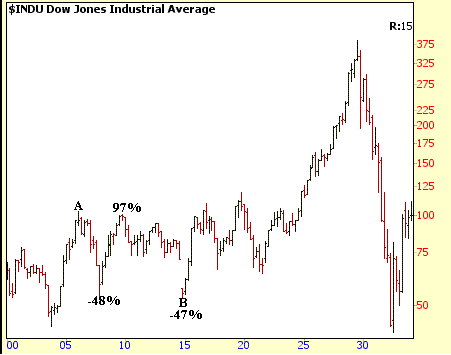 The second period
was in the 1970's as the Dow gained 80% after bottoming in late 1974. In
this case the Dow got within 4% of its previous 1973 high (point C) before
peaking. This was then followed by a choppy 6 year consolidation
period (blue lines) before it eventually broke out in 1983. However in
this case the Dow never came close to retesting its 1974 low during the
consolidation period. If the Dow follows these two patterns then its
likely getting close to peaking. 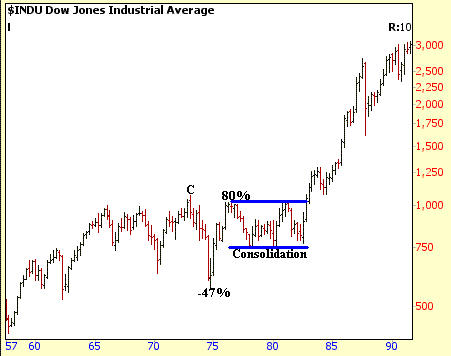
Meanwhile another
possible pattern the Dow could be exhibiting is a large Broadening Top
pattern. The S&P 500 developed a Broadening Top pattern in the 1970's
as shown below. Keep in mind this is an extremely bearish pattern as once
the final 5th Wave completes a large sell off follows. In addition notice the
5th Wave had an "abc" look to it as well. 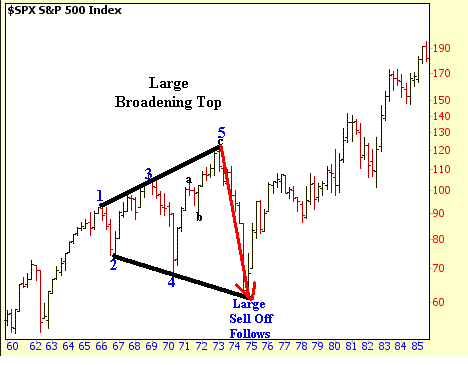 Now if we look at
the current chart of the Dow the move up from the 2009 low would be the final
5th Wave. Thus in this pattern the Dow would have to rise above its
previous all time high of 14198 to complete the pattern. Once the
5th Wave ends then a massive sell off would follow with a drop back below the
6000 level. 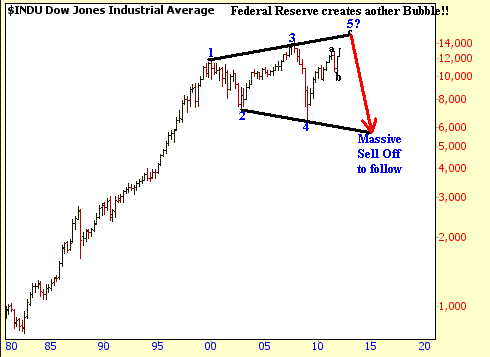
At this time I
would favor the first two patterns talked about above with the Dow stalling out
just below its all time high. However if the Federal Reserve
continues to print money to prop up the market on low volume
then the Broadening Top pattern can't be completely ignored. Stocks
to Watch JBHT which I mentioned last weekend as a stock
to watch on broke out of its Flat Base this week accompanied by average
volume. If you took a position in it at the $53 level make sure to place
your initial Stop Loss at the $50 level. The initial target price is at
$60. 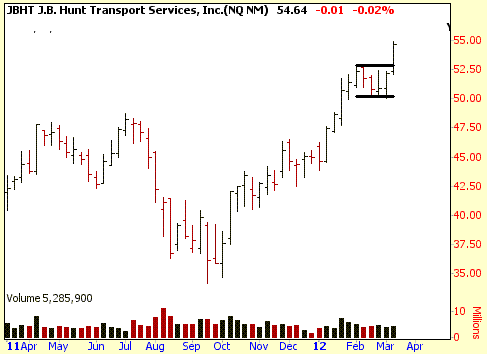
Amateur Investors
|


