|
(6/7/14)
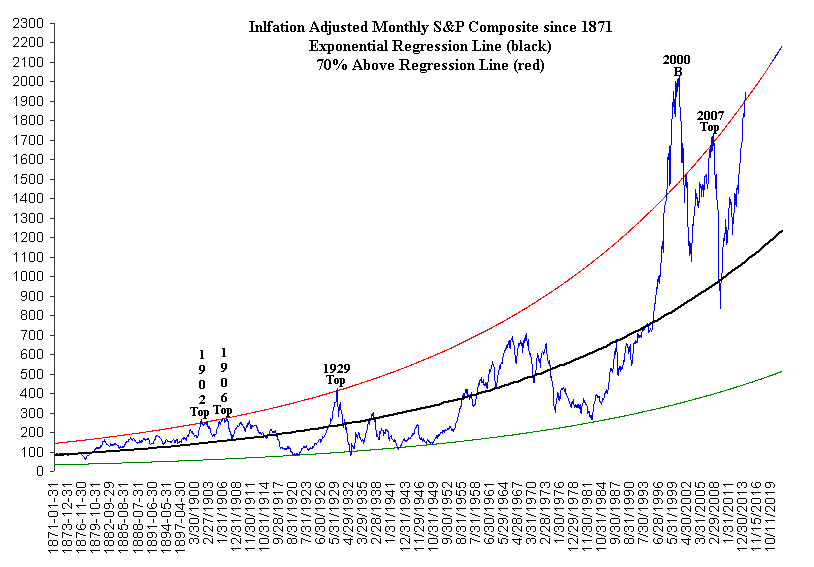
The S&P 500 is now 74% above its long term exponential
regression line (black line) which has been a rare occurrence. Historically when the S&P 500 has risen 70% above its exponential
regression line (denoted by the red line) tops have followed except for the late
1990's period (point B). Thus we have two scenarios to watch for in the months
ahead. #1: The first scenario is that the
S&P 500 is nearing a major top which will be followed by a significant
correction. #2: The second scenario is that we will see a repeat of
the period from late 1998 through early 2000 in which the S&P 500 was able
to rise well above the red line. In this scenario the S&P 500 would be
able to gain another 25% or so from current levels by late 2015 or early 2016
before peaking. Personally I never thought the S&P 500 would
rally this quickly back to the red line since it has been an extremely rare
event dating back to the early 1870's but here we are. Right now the
market is in a parabolic move like that of the late 1920's and late 1990's and
is acting like a rubber band. Thus it's just a question of how much
longer the rubber band can be stretched before it snaps. 
Amateur Investors
|


