|
(6/13/15)
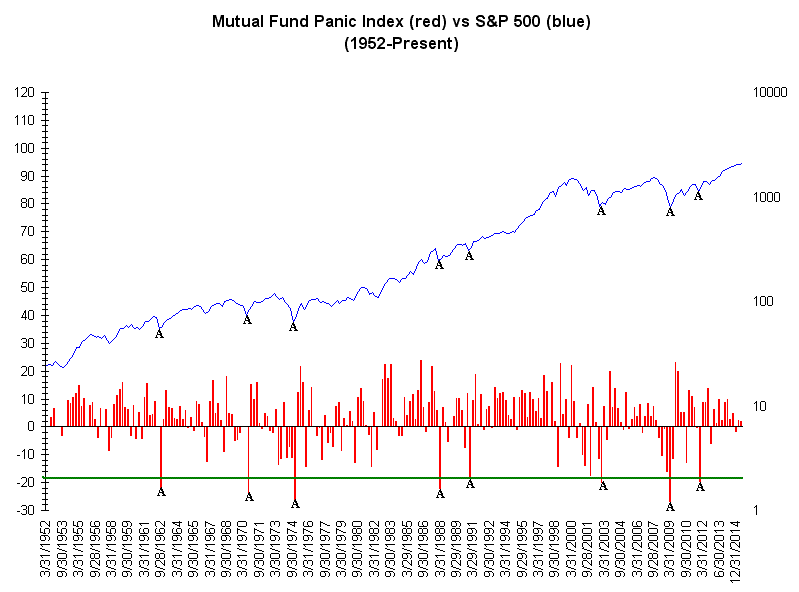
I haven't mentioned the Mutual Fund Panic Index (MFPI) in awhile
which was developed by us 10 years ago. This index tracks inflow and
outflows out of equities by Mutual Funds on a Quarterly basis with data going
back to the early 1950's. When the MFPI drops to -18 (green line) long
term Buy Signals (points A) have occurred in the market with the last signal in
the Fall of 2011. On average when a Buy Signal has occurred the S&P
500 has rallied at least 70% in each case. Since the Fall 2011 low the
S&P 500 has rallied 99%. 
Although the MFPI does an excellent
job of timing long term Buy Signals I really haven't found much use for it in
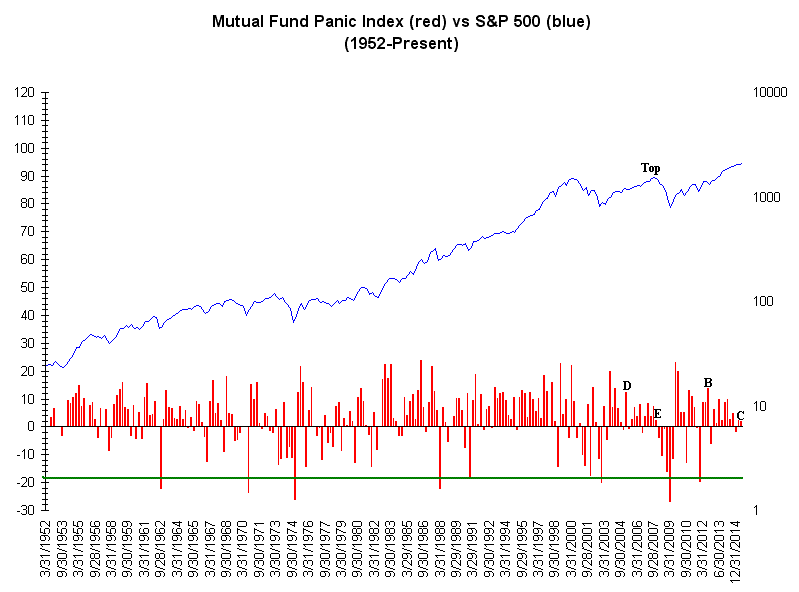
timing long term Sell Signals. However one thing I have noticed during the
past few years is that the inflow into equities has been steadily decreasing
(points B to C). Overall a similar trend occurred from 2005 through
2007 (points D to E) before the S&P 500 peaked in late 2007 so this will be
something to watch in the months ahead. 
Amateur Investors
|


