|
(2/27/16)
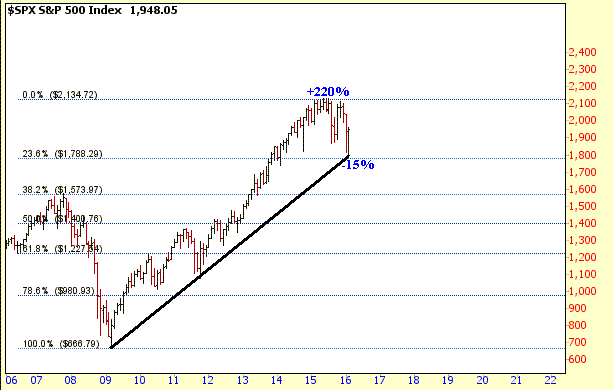
So far the S&P 500 has only corrected 15% from its all time
high of 2135 and hasn't even retraced 23.6%. After a 220% gain from March
of 2009 this is a very small correction in the bigger picture. Meanwhile
the S&P 500 has bounced strongly off its longer term upward trend line which
was just above the 1800 level.

In the short term the key question is what type of wave
structure has developed since the peak in May of 2015? In my opinion there
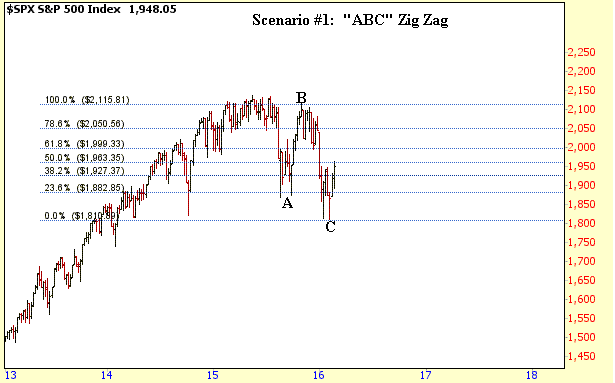
are three possibilities. The bullish pattern is that a simple
"ABC" Zig Zag correction has occurred which will be followed by one
more higher high in the S&P 500 with a target range from 2200 to 2300.

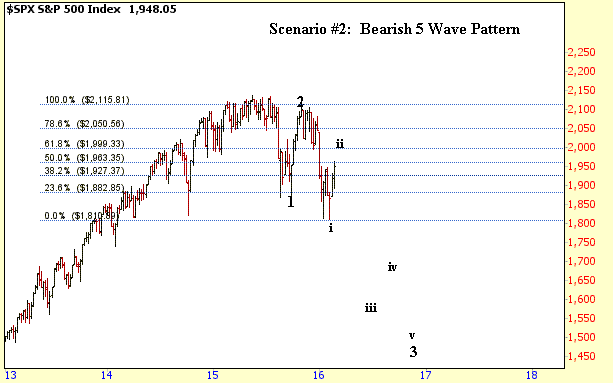
The second potential pattern is that we are seeing the early
stages of a much larger correction which will evolve into a 5 Wave affair.
In this bearish scenario Waves 1 and 2 have already completed while Wave 3 is in
its early stages. The target for the 3rd Wave would be around the
1500 level.

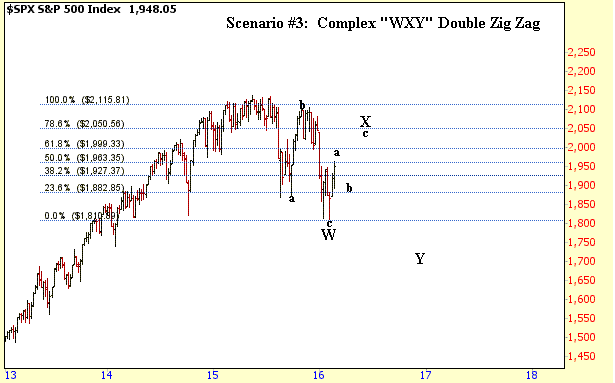
Finally the third possible scenario is a complex "WXY"
Double Zig Zig pattern. In this scenario "W" completed with the
1810 low with "X" and "Y" to follow. In this scenario
the S&P 500 would rally back to the 2000 to 2050 area to complete
"X". This would then be followed by "Y" with a target
range from 1750 to 1700.

At this point nobody really knows what type of pattern is
evolving. However going forward the 2050 level is a key level in my
opinion which is the 78.6% Retrace for the last move downward. If the
S&P 500 were to rally above the 2050 level by the end of March then Scenario
#1 would be favored. Meanwhile if the S&P 500 fails to rally above the
2050 area by the end of March then that would favor either Scenario #2 or
#3.
Amateur Investors
|


