|
(2/11/12)
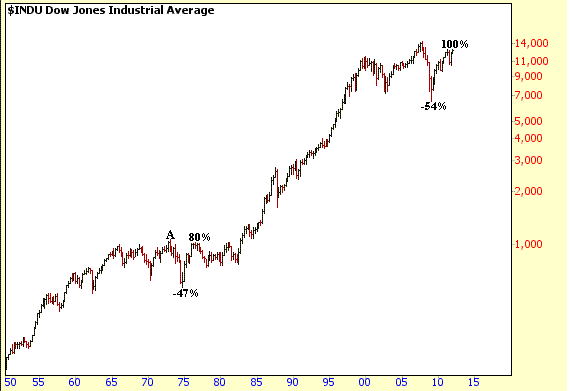
The action in the Dow since its October 2007 peak is very
similar to that of the 1970's. Back then the Dow peaked in early 1973
(point A) which was followed by a sharp 47% correction. This was then
followed by an impressive rally over the next few years as the Dow nearly got back
to its previous high as it gained 80%. So far since the March 2009 low the
Dow has rallied 100%. 
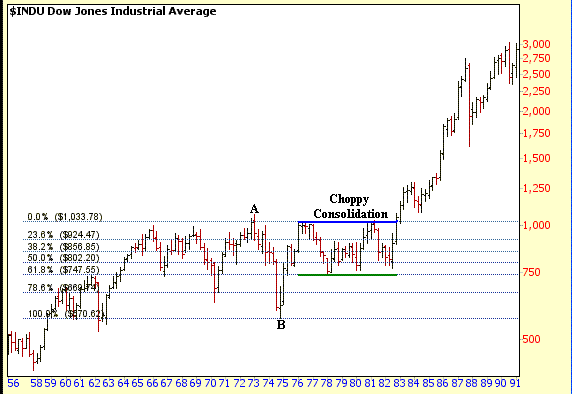
Next if we take a
closer look at the 1970's period after the Dow bottomed in late 1974 (point B)
it then retraced just over 88% by the middle part of 1976 as it got close to its
previous high made in early 1973 (point A). After peaking in 1976
this was then followed by a choppy "6" year consolidation pattern
through 1982. The top of the consolidation pattern coincided with the 1976
high (blue line) while the lower end of the consolidation pattern coincided with
the 61.8% Retrace (green line) calculated from the 1974 low to the 1976
high. Meanwhile the Dow finally broke out of the consolidation
pattern in 1983 as it made another substantial move higher before the 1987
crash. 
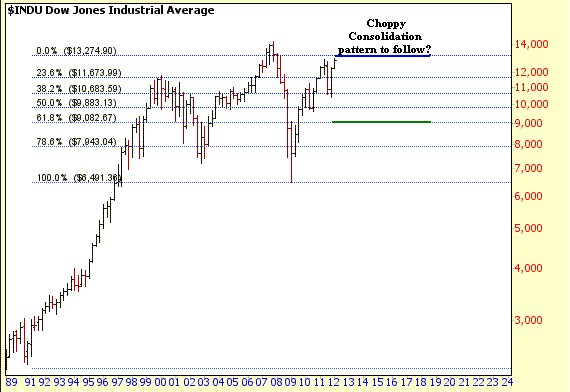
Finally so far the Dow has retraced
80% from the October 2007 high to the March 2009 low. If a
similar pattern is developing like the 1970's and the Dow retraces around 88%
that would lead to a value around 13275 for a
potential top. This would then be followed by a choppy consolidation
pattern with the bottom around 9100 as that would be a 61.8% Retrace from the
March 2009 low to 13275. If the consolidation pattern lasted at
least "6" years like the previous one in the 1970's then that would
take us through 2018. 
Amateur Investors
|


