|
(12/10/11)
The Mutual Fund Panic Index came close to triggering another
Long Term Buy Signal based on the latest data from the Federal Reserve that was
reported on December 8th. Long Term Buy
Signals have triggered when the red bars have dropped to -20 or below (points
A). Since the early 1950's only 6 Long term Buy Signals have
occurred with the last one in March of 2009 which was followed by 105% rally in
the S&P 500. Furthermore every time a Buy Signal has been
triggered the S&P 500 has rallied 70% or more from the
low. 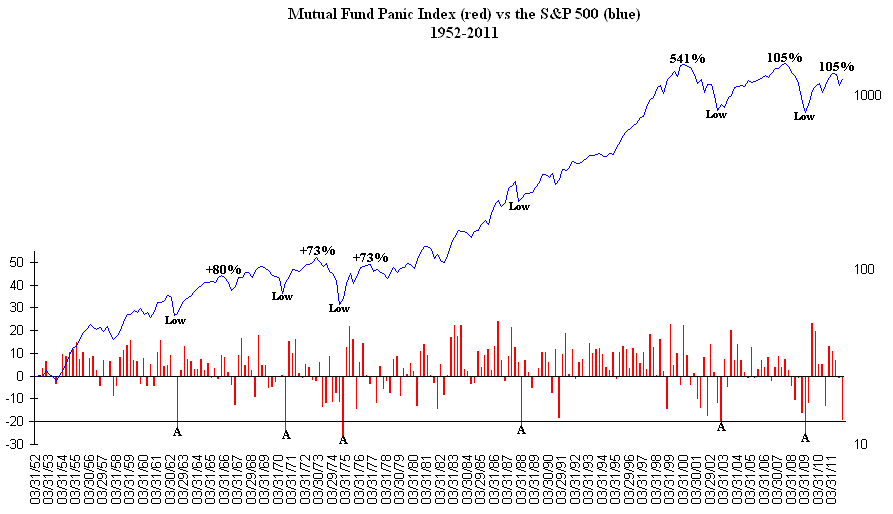
As
far as the near term once again it still looks like a possible "WXY"
Double Zig Zag pattern from the early October low of 1075. "W"
rallied up to 1293 while "X" dropped back to 1158. Meanwhile we
currently would be in "Y" which should have an "abc" look to
it as "b" of Y may have completed at the 1232 level on Thursday.
The target for "c" of Y still looks to be in the 1320's which would
coincide with the trend line connecting the April and July highs (black
line). 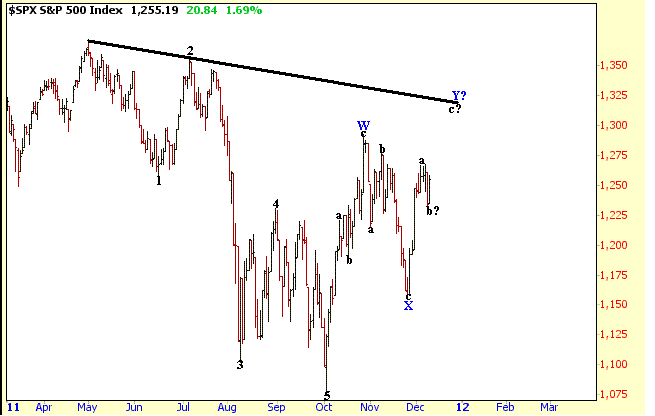
Amateur Investors
|

