|
(8/29/15)
Although the market rallied strongly from the low on Tuesday
history suggests that more volatility is on the way in the coming weeks. Early in the week four conditions occurred which have only
happened "4" other times since 1900 and are listed below. 1. Dow or S&P Composite
dropped 10% in 5 Days or less.
2. Dow and S&P Composite were within 4 months of an "All Time
High"
3. Shiller PE was 20 or above
4. The 20 Month Moving Average was tested. Prior to the
most recent event these conditions were met in January of 2008, April of 2000,
August of 1998 and October of 1929. I will now show charts of these prior
"4" events. The most recent occurrence prior to the
current one was in January of 2008. There was a sharp 10% correction over
a period of 5 trading days which was then followed by a 10% rally. This
was then followed by a retest of the previous low 6 weeks later (point A). 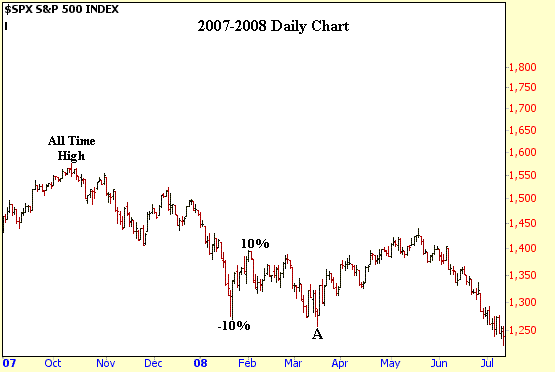 In the longer term the 1576 high
made in October of 2007 marked a significant top which was eventually followed
by a 58% correction. 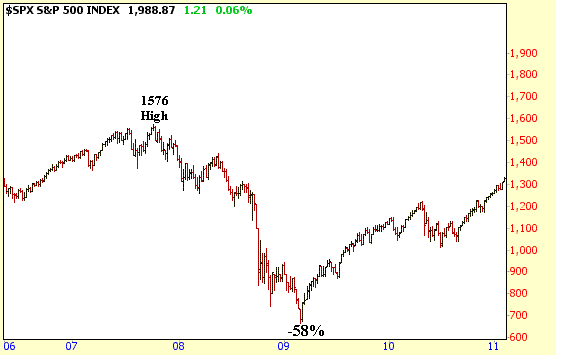
Meanwhile in April of 2000 there was
a 12% correction over a period of 5 trading days which was then followed by a
sharp rally of 10%. In this case the S&P got stuck in a choppy trading
range for several months before selling off in the Fall of that year (points B
to C). 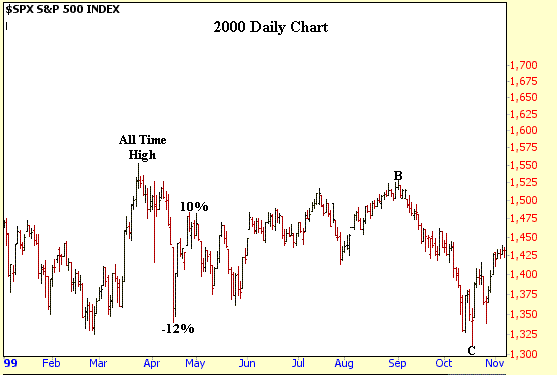
In the longer term the 1553 high
made in March of 2000 marked a significant top which was eventually followed by
a 50% correction. 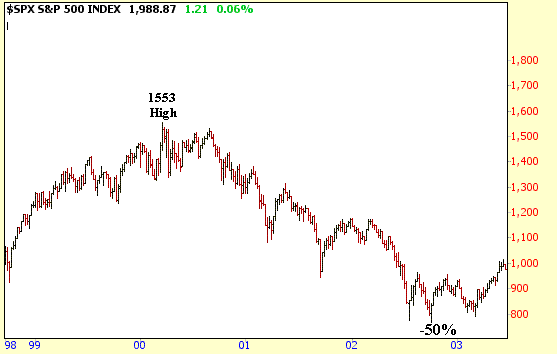
The next case was in late August of
1998 as the S&P fell 15% in 4 trading days which was followed by a 13% rally
during the next 4 weeks. This was then followed by an eventual retest of
the previous low in October of that year. 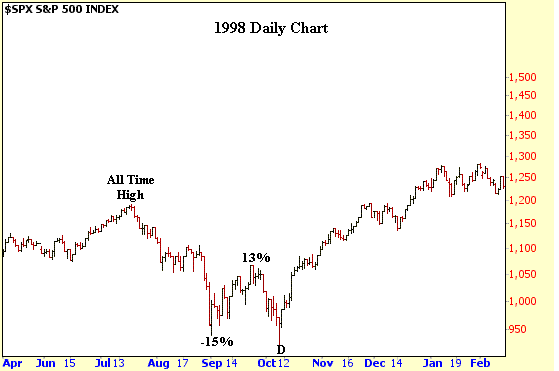
This is the only case out of the
"4" prior events in which the S&P 500 was able to make a new all
time high. In this example you can see it formed a Double Bottom pattern
after falling 22% from its previous all time high. This was then followed
by a strong rally from 1999 into early 2000. 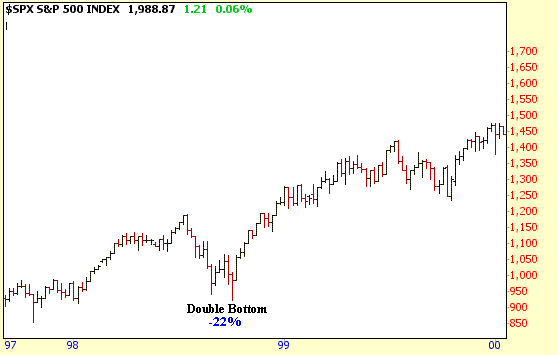
The last event was in October of
1929 as the S&P fell 10% in 5 trading days by early October . This was
then followed by an 11% bounce before selling pressure resumed. 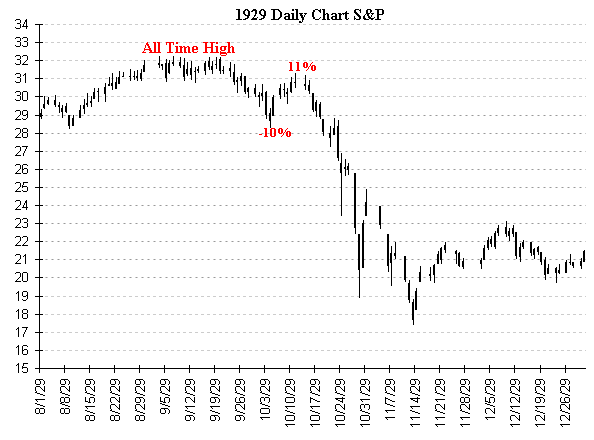
As most investors know this was a precursor
to the largest sell off in history as the S&P eventually fell 86% after
peaking in September of 1929. 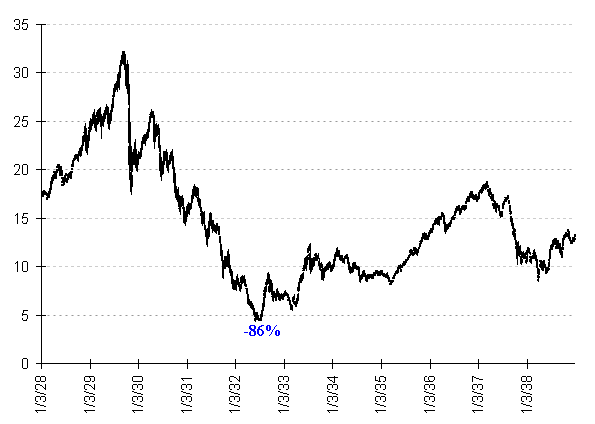
So here we are again as the S&P
500 dropped 11% in 5 trading days and has rebounded strongly since
Tuesday. This is the same scenario that has evolved with prior events so
nothing unusual has occurred so far. Also one would expect a 10% rally
from the 1867 low before another round of significant selling takes place. So
far the S&P 500 has risen 7% from its low so another 3% isn't out of the
question which would yield a target around 2050. 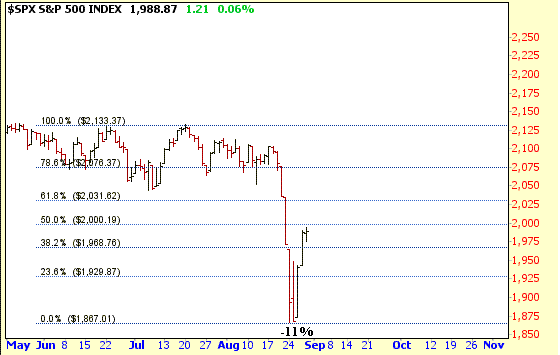 However one thing to consider is
that the S&P Futures dropped to 1831 on Monday but the Cash Value only fell
to 1867 so there was a 36 point difference between the two. Since the
Futures drive the market the S&P 500 Futures have already rallied 8.7% off
their lows since Monday. Thus a 10% rise would lead to a value
around 2014 which is right at their 61.8% Retrace. So based on this
the S&P Cash may not rise as much as one would
think. 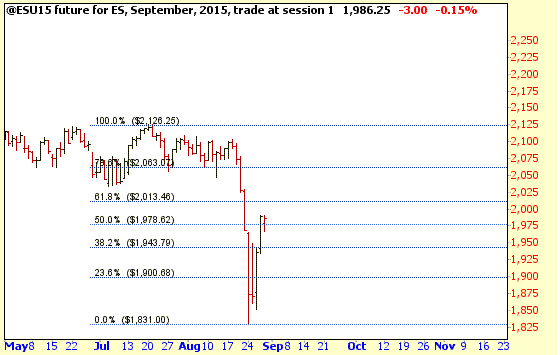
Amateur Investors
|


