
Weekend Analysis
(8/24/02)
The Market
Considering how much the major averages have risen since the July 24th low especially in the Dow and S&P 500 we should expect too see some type of pullback in the short term. Now this pullback can either be constructive or turn into something not so constructive.
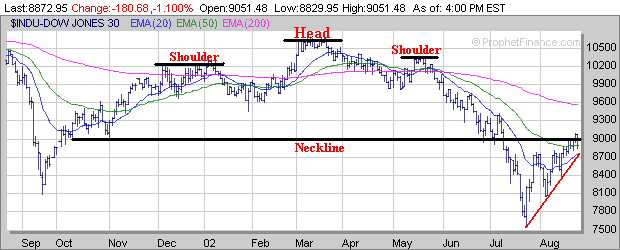
The Dow through Thursday had risen nearly 20% since making a low on July 24th. The Dow did briefly rise above a key resistance level at its Neckline near 9000 in association with its Head and Shoulders pattern but closed below it on Friday. For the Dow to be constructive next week it must find support near the 8750 level which is where its 20 Day Exponential Moving Average (EMA) and upward sloping trend line (red line) from the July 24th low are converging at. If the Dow breaks strongly below the 8750 support area this could spell trouble going into September. Meanwhile if the Dow can hold support near the 8750 level and then rally strongly above its Neckline near 9000 there still is a chance of another leg up possibly to its 200 Day EMA (purple line) near 9600.
The Nasdaq through Thursday had rallied 19% since making a low on July 24th and for the first time since last March got above its 50 Day EMA (green line). The key support level to watch next week is near the 1350 area which is where the Nasdaq's 20 Day EMA (blue line) and newly developed upward sloping trend line (red line) are converging at. If the Nasdaq breaks strongly below the 1350 level this will likely lead to a retest of the July 24th low near 1200 as we head into September. Meanwhile if the Nasdaq can hold support next week near the 1350 level and rise above its 50 Day EMA near 1400 then there is still a chance it could rally back to its longer term downward sloping (black line) near 1500.
The S&P 500 up until Thursday had rallied nearly 24% since the July 24th low and had risen above its 50 Day EMA (green line) for the first time since last March. The key short term support level to watch next week is near the 925 area which is where the S&P 500's 20 Day EMA (blue line) and upward sloping trend line (red line) from the July 24th low are converging at. If the S&P 500 breaks well below the 925 level this would spell trouble as we move into September and could eventually lead to a retest of the July 24th low near 775 sometime in the Fall. Meanwhile if the S&P 500 can hold support near the 925 level and begin to rebound there is still a chance that it could rally up to the 975 level (50% retracement from the March high to the July 24th low) or 1000 area which is along its downward sloping trend line (black line) established from the March high.
The Contrarian Indicators so far show that the majority of Investment Advisors haven't bought into this latest rally as the % of Bullish Advisors (red line) actually dropped this past week while the % of Bearish Advisors (blue line) increased so from a Contrarian point of view this is may be a good sign for the market. However I would like to point out that in the Fall of 1998 when the S&P 500 made a retest of its August low, leading to the development of a Double Bottom pattern, the % of Bullish Advisors (point A) was still considerably less than the % of Bearish Advisors (point B).
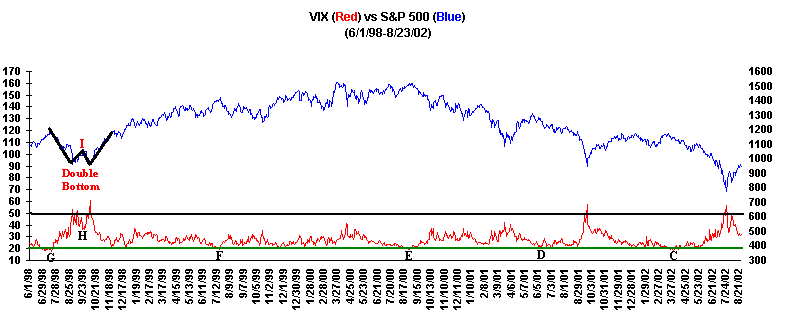
The Volatility Index (VIX) has been dropping since the market bottomed on July 24th but still is rather far from levels (20 or below) that have warned of a nearing top in the past (points C, D, E, F and G). However I would like to point out that in the Fall of 1998 when the S&P 500 made a "Double Bottom" pattern (looks like the letter "W") the VIX never did drop below the mid 30's (point H) as the S&P 500 topped out (point I) before selling off leading to a retest of the August low.
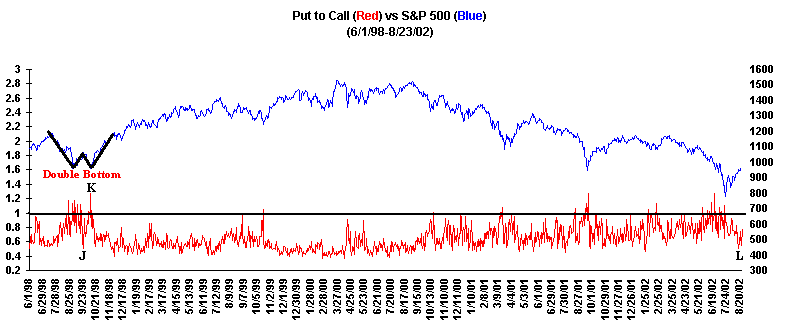
Meanwhile if we look at the Put to Call Ratio back in 1998 it dropped very quickly (point J) as the S&P 500 rallied off of its first bottom in August and then rose sharply (point K) as the second bottom was nearing which led to the formation of the Double Bottom pattern. If we look at the current readings in the Put to Call Ratio a similar situation could be developing as the Put to Call Ratio did drop significantly this past week (point L).
As we head into the months of September and October just be aware that a retest of the July 24th lows are still possible and can't be totally ignored. Historically if we examine the performance of the Dow over the past 30 years or so in the August through October time period the Dow has been down an average of 1.5% during the end of that 3 month period. Now that doesn't mean every year is the same as there has been a few good years especially in 1982 but there has been some awful years as well especially in 1974, 1987, 1990 and 2001. One of the more interesting years was in 1998 when the Dow dropped nearly 19% early that Fall but by the end of October was up by 5%. So it will be interesting to see how things play out by the end of this October.
|
Performance of the Dow 1971-2001 (August 1-October 31) |
| 8/1 | Lowest | Date | Max Loss | 10/31 | % Change | |
| Close | Level | (8/1-10/31) | Close | 8/1-10/31 | ||
| 1987 | 2572 | 1616 | 10/20/87 | -37.2% | 1993 | -22.5% |
| 1990 | 2899 | 2344 | 10/11/90 | -19.1% | 2442 | -15.8% |
| 2001 | 10510 | 7927 | 09/21/01 | -24.6% | 9075 | -13.7% |
| 1974 | 751 | 573 | 10/4/74 | -23.7% | 665 | -11.5% |
| 1981 | 946 | 808 | 09/28/81 | -14.6% | 853 | -9.8% |
| 1997 | 8194 | 6936 | 10/28/97 | -15.4% | 7442 | -9.2% |
| 1977 | 892 | 793 | 10/25/77 | -11.1% | 818 | -8.3% |
| 1978 | 861 | 782 | 10/30/78 | -9.2% | 793 | -7.9% |
| 1992 | 3394 | 3087 | 10/05/92 | -9.0% | 3226 | -4.9% |
| 1979 | 850 | 796 | 10/22/79 | -6.4% | 816 | -4.0% |
| 1971 | 865 | 828 | 10/28/71 | -4.3% | 839 | -3.0% |
| 1976 | 982 | 928 | 10/12/76 | -5.5% | 965 | -1.7% |
| 1980 | 931 | 918 | 09/29/80 | -1.4% | 924 | -0.8% |
| 1989 | 2641 | 2497 | 10/16/89 | -5.5% | 2645 | 0.2% |
| 1999 | 10654 | 9884 | 10/18/99 | -7.2% | 10730 | 0.7% |
| 1988 | 2130 | 1988 | 09/01/88 | -6.7% | 2149 | 0.9% |
| 1995 | 4700 | 4553 | 08/24/95 | -3.1% | 4755 | 1.2% |
| 1975 | 826 | 781 | 10/01/75 | -5.4% | 836 | 1.2% |
| 1985 | 1356 | 1284 | 09/18/85 | -5.3% | 1374 | 1.3% |
| 1991 | 3018 | 2926 | 10/07/91 | -3.0% | 3069 | 1.7% |
| 1983 | 1194 | 1152 | 08/09/83 | -3.5% | 1225 | 2.6% |
| 1972 | 930 | 927 | 9/26/72 | -0.3% | 955 | 2.7% |
| 1994 | 3798 | 3722 | 08/22/94 | -2.0% | 3908 | 2.9% |
| 2000 | 10607 | 9874 | 10/12/00 | -6.9% | 10971 | 3.4% |
| 1993 | 3539 | 3508 | 09/24/93 | -0.9% | 3681 | 4.0% |
| 1973 | 912 | 846 | 8/22/73 | -7.2% | 957 | 4.9% |
| 1998 | 8868 | 7380 | 09/01/98 | -16.8% | 9345 | 5.4% |
| 1984 | 1135 | 1138 | 08/02/84 | 0.3% | 1207 | 6.3% |
| 1986 | 1764 | 1734 | 09/12/86 | -1.7% | 1878 | 6.5% |
| 1996 | 5595 | 5550 | 09/03/96 | -0.8% | 6029 | 7.8% |
| 1982 | 822 | 770 | 08/09/82 | -6.3% | 922 | 12.2% |
At any rate watch those short term support levels in the major averages next week which were 8750 (Dow), 1350 (Nasdaq) and 925 (S&P 500). Any significant drop below these levels would spell trouble as we move into the month of September.
AII Top 100
Industry Group wise the Banks continue strong although most of them are smaller stocks with low daily trading volumes which always makes them more risky.
(Industry Groups with a Relative Strength >= 80 and steadily increasing over the past 6 Months.)
| INDUSTRY | CURRENT | 1 Month | 3 Months | 6 Months | Total Return |
| GROUP | RANK | Ago | Ago | Ago | since 1/1/02 |
| Banks-West | 99 | 96 | 88 | 73 | 24.1% |
| Oil&Gas-Canadian Integrated | 99 | 92 | 55 | 30 | 11.8% |
| Medical-HMO's | 99 | 99 | 99 | 82 | 48.8% |
| Banks-Southeast | 98 | 98 | 77 | 66 | 17.8% |
| Banks-Northeast | 98 | 98 | 83 | 82 | 22.8% |
| Banks-Midwest | 97 | 97 | 76 | 60 | 15.8% |
| Food-Dairy | 96 | 92 | 29 | 21 | 10.1% |
| Oil&Gas-Intl Specialty | 95 | 93 | 89 | 20 | 7.4% |
| Commercial Services-Education | 94 | 80 | 64 | 56 | 9.0% |
| Chemicals-Specialty | 92 | 84 | 61 | 56 | 9.4% |
| Diversified Operations | 90 | 84 | 70 | 59 | 8.7% |
| Banks-Super Regional | 89 | 68 | 50 | 48 | 5.5% |
| Utility-Gas | 86 | 54 | 44 | 34 | -4.6% |
| Building-Maintenance | 83 | 81 | 79 | 54 | -1.0% |
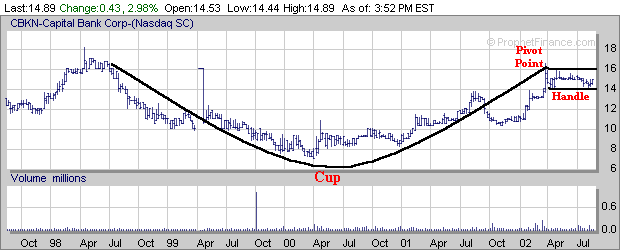
A few Bank stocks to watch include CBKN which has formed a 2 1/2 month Handle after developing a 4 year Cup. Its Pivot Point is near $16.25. Average Daily Volume: <10,000
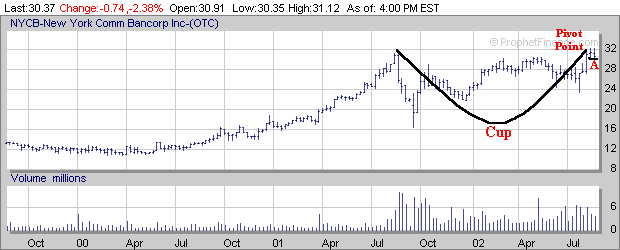
NYCB has formed a small 2 week Handle (point A) after
developing a 1 year Cup. Its Pivot Point is just above $32.
Average Daily Volume: 854,000
Some other Stocks to Watch (all charts are weekly unless
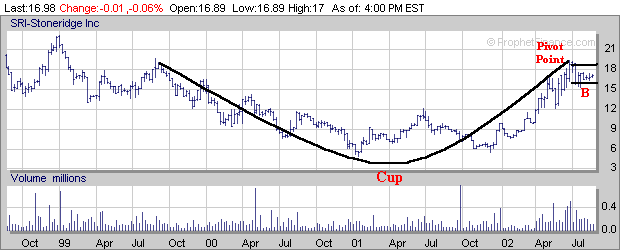
otherwise denoted) which have developed Handles include SRI which has
formed a 7 week Handle (point B) after developing a 2 1/2 year Cup. Its
Pivot Point is near $19.50.
Average Daily Volume: 51,000
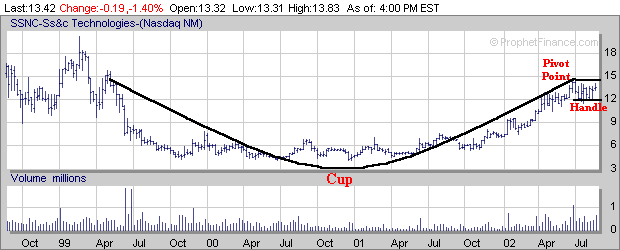
SSNC has formed a 7 week Handle after developing a 3 year
Cup. Its Pivot Point is near $15.
Average Daily Volume: 85,000
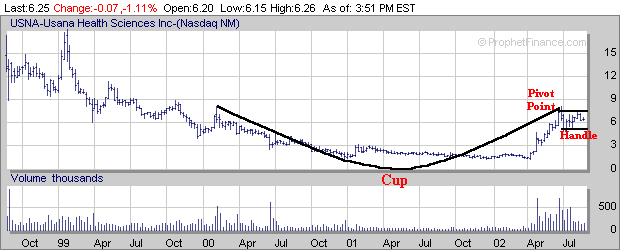
USNA has formed a 9 week Handle after developing a 3 year
Cup. Its Pivot Point is near $8.
Average Daily Volume: 77,000
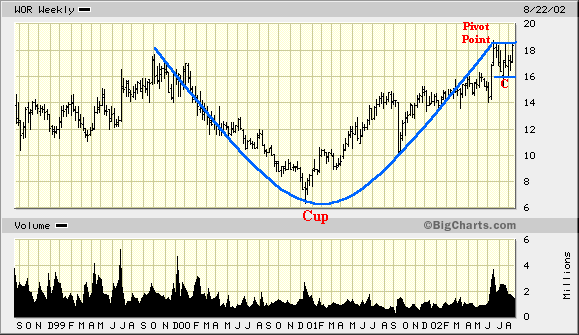
WOR has formed an 8 week Handle (point C) after developing a 2
1/2 year Cup. Its Pivot Point is near $18.50.
Average Daily Volume: 414,000
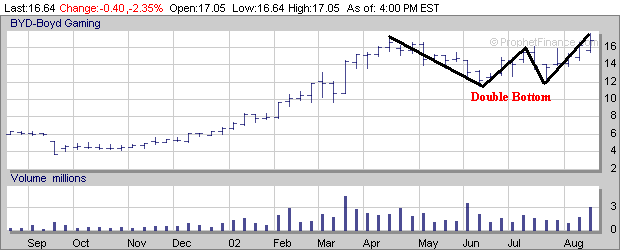
Some other stocks which have been developing bases but need to form a constructive Handle include BYD which has developed a Double Bottom pattern (looks like the letter "W").
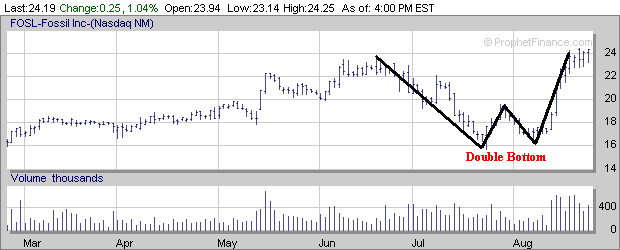
FOSL also has formed a Double Bottom pattern and needs to continue to develop a Handle.
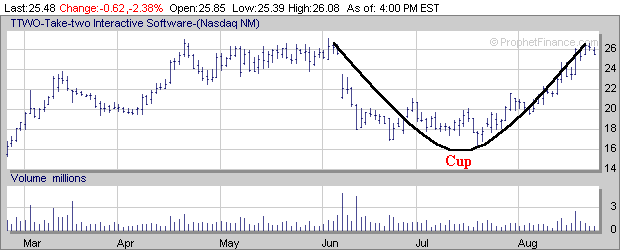
TTWO has formed a 3 month Cup and now needs to develop a constructive Handle over the next few weeks.
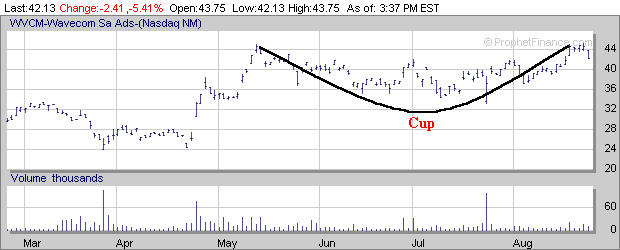
Finally WVCM has formed a 3 month Cup and also needs to develop a constructive Handle over the next few weeks.
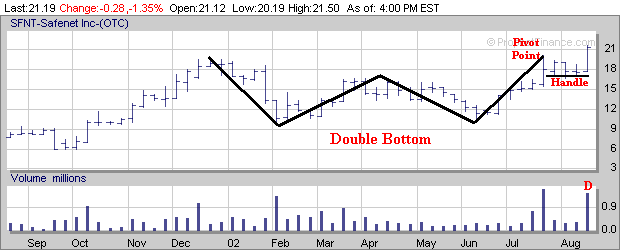
Continue to focus on those stocks breaking above their Pivot Points accompanied by good volume. SFNT is a good example of a stock which broke out of 3 week Handle and above its Pivot Point last week on good volume (point D) after developing a Double Bottom pattern. If you were fortunate enough to time this one right make sure to use a protective Stop Loss Order just in case this breakout attempt fails to follow through. If you use William O'Neils strategy of placing a Stop Loss 8% below the Pivot Point this would yield a price of around $18.50 (8% of $20).
As mentioned in the market analysis the Contrarian Indicators really aren't showing signals of a nearing top yet. However as I talked about they didn't flash any strong signals back in the Fall of 1998 either when the major averages eventually retested their August lows while completing a Double Bottom pattern. So this is something we should be aware of as we move in the months of September and October.
| Stock Deleted from AII Top 100 |
Stocks Added to AII Top 100 |
Stocks dropped from AII Portfolio |
Stocks Added to AII Portfolio |
Earnings Reports |
|
BEL, FWHT, QDIN and STLD |
LCI, NYCB, PFCB and TTWO | SCHN | WOR | None |