|
(8/22/15)
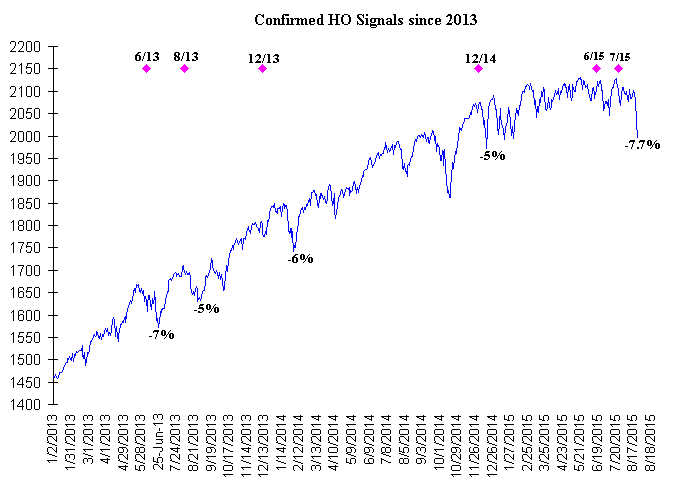
Back in June and July we had Confirmed Hindenburg Omens which
was a warning sign not to be long in the market. Since then the S&P
500 is down about 7.7% from its May high while the Dow is down 10%.
As you can see since 1980 there have only been "11"
Confirmed HO
Signals when the Shiller PE Ratio was above 18 and the S&P 500 was at least 100%
above its 5 Year Low so it has been a rare occurrence. The HO
Signals in 2007, 2000/1999 and 1987 were followed by substantial corrections
ranging from 36% to as high as 58%.
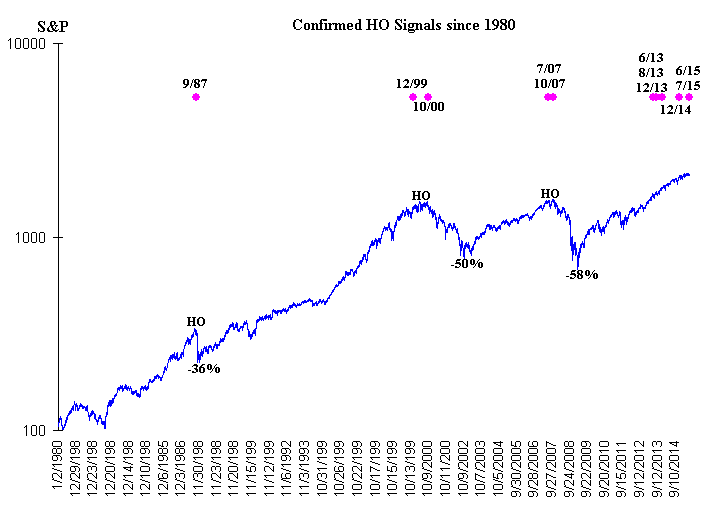
However the Signals in 2013 and 2014 were only followed by minor
corrections ranging from 5% to 7% which were then followed by a new high.
Currently the S&P 500 is down 7.7% from its all time high which is the
largest correction we have seen with the HO Signals the last two years.
Finally the one thing to watch the
next two months is whether the S&P 500 closes below its 20 Month Moving
Average (green line). The last two major Bull Markets ended when the
S&P 500 closed two months in a row below its 20 Month Moving Average (points
A). 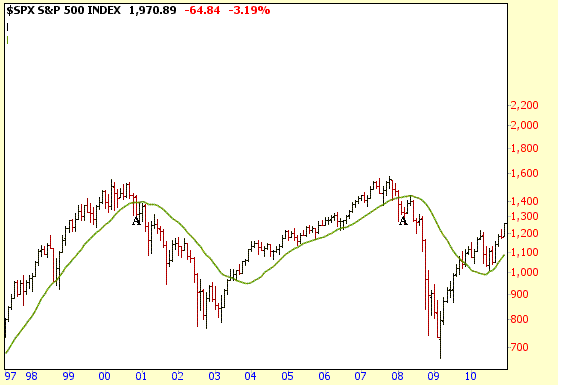
Currently the S&P 500 has
dropped below its 20 Month MA which was at 1991. Thus I will be watching
to see if the S&P 500 closes below its 20 Day MA by the end of the month. 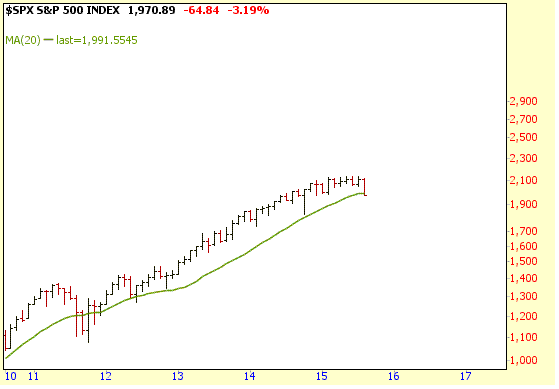
Amateur Investors
|

