|
(8/19/17)
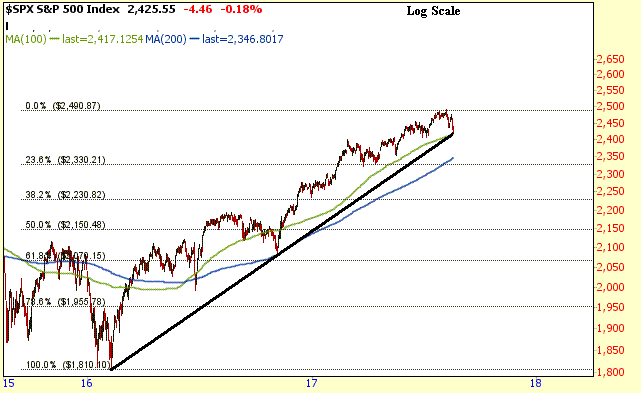
The market was rather volatile this week as the S&P 500
tested a key support level just above the 2400 level on a log scale.
Notice this is where the 100 Day Moving Average (green line) and upward trend
line (black line) from the early 2016 low converged at. Thus this is a key
area to watch next week. If the S&P 500 closes below the 2400 level
then a drop back to the 2347 to 2330 range is certainly possible before the end
of the month. 2347 is along the 200 Day Moving Average (blue line)
while 2330 is the 23..6% Retrace from the early 2016 low to the most recent
high.

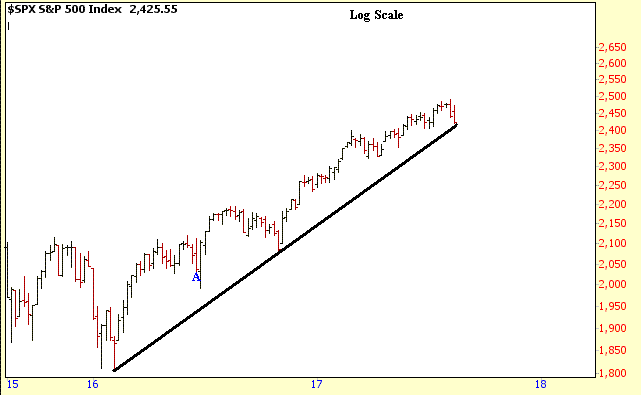
Meanwhile the S&P 500 hasn't seen 3 consecutive down weeks
since June of 2016 (point A) so we shall see what next week brings.

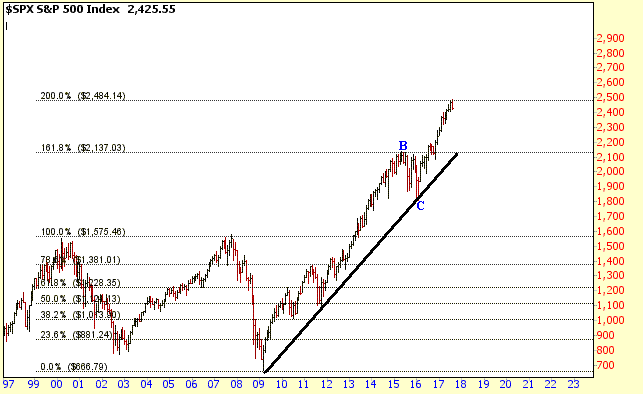
Finally the S&P 500 has encountered resistance near its 200%
Extension Level calculated from the 2007 high to the 2009 low which was around
the 2485 level. It will be interesting to see if a similar outcome
develops like the Summer/Fall 2015 period, in which the S&P 500 encountered
resistance at its 161.8% Extension Level (point B). This was then followed
by a test of its longer term upward trend line (point C).

Amateur Investors
|


