|
(8/12/17)
The VIX rose 44% on Thursday which was the 9th largest Daily % gain
since 1990. However the S&P 500 only fell 1.5% which isn't very much
based on other events that exceeded 2% in most cases. Also notice in 8 out
of the 10 events the S&P 500 closed higher the next trading day, so Friday's
bounce wasn't much of a surprise.
10 Largest Daily Gains in the VIX since 1990
| Date |
VIX |
S&P 500 |
S&P 500 |
Low |
# of |
Next |
|
% Gain |
Daily Loss |
Max Loss |
Date |
Days |
Day |
| 02/27/2007 |
64.2 |
-3.4 |
-5.9 |
3/14/2007 |
12 |
Up |
| 11/15/1991 |
51.7 |
-3.7 |
-6.5 |
12/2/1991 |
11 |
Up |
| 07/23/1990 |
51.5 |
-1.7 |
-18.6 |
10/11/1990 |
58 |
Up |
| 08/08/2011 |
50.0 |
-6.7 |
-10.4 |
10/4/2011 |
41 |
Up |
| 06/24/2016 |
49.3 |
-3.6 |
-5.8 |
6/27/2016 |
2 |
Down |
| 08/21/2015 |
46.4 |
-3.2 |
-8.5 |
8/24/2015 |
2 |
Down |
| 05/17/2017 |
46.4 |
-1.8 |
-2.2 |
5/18/2017 |
1 |
Up |
| 08/24/2015 |
45.3 |
-5.3 |
-5.3 |
8/24/2015 |
1 |
Up |
| 8/10/2017 |
44.4 |
-1.5 |
? |
? |
? |
Up |
| 04/15/2013 |
43.2 |
-2.3 |
-3.8 |
4/18/2013 |
4 |
Up |
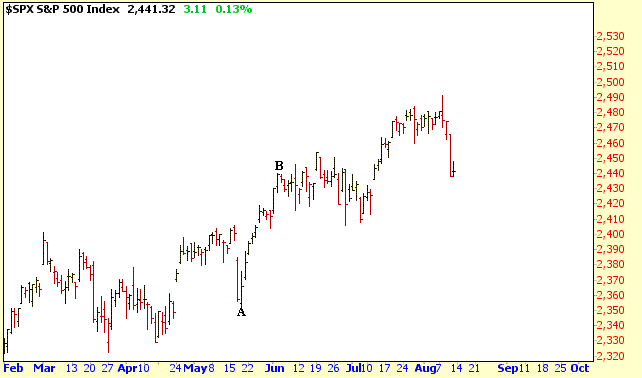
I'm sure many believe that a repeat of May 17th will occur in
which the VIX rose 46%. This was followed by a bottom in the S&P 500
the next day (point A) and a sharp rally to new all time highs (points A to B).
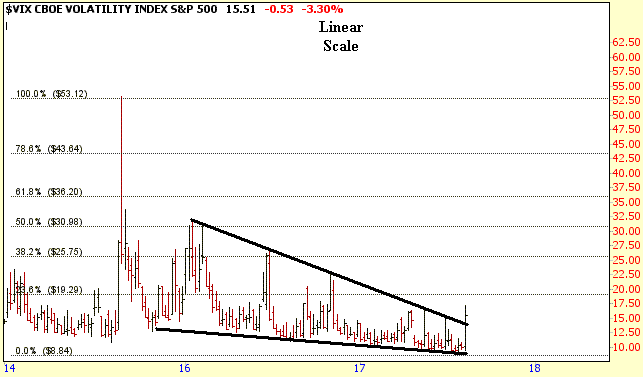
Meanwhile the VIX, on a linear scale, is attempting to break out
of its narrowing downward channel which has been in place for several months.
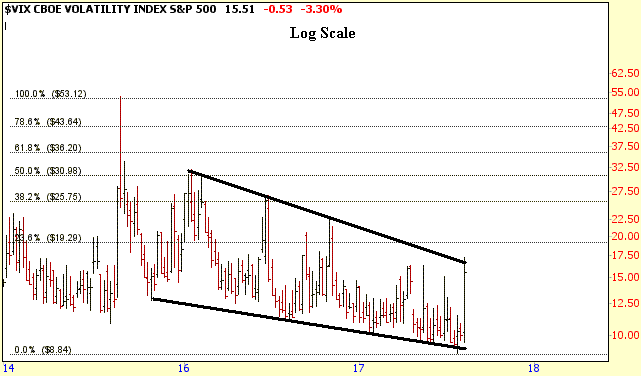
However, looking at a log scale, the VIX encountered resistance at
the top of its downward channel. Thus the question is will the VIX follow
through to the upside or not the next few weeks?
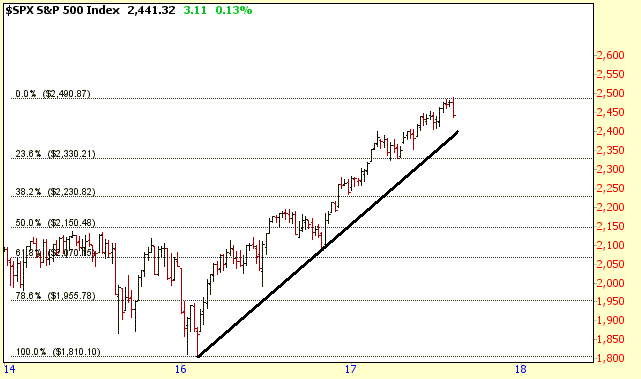
Despite the VIX rising substantially this week the S&P 500
only dropped 2% from its all time high. If the S&P 500 continues to
pullback there is support around the 2400 level which is along the upward trend
line from the early 2016 low.
Amateur Investors
|

