|
(4/29/17)
The Implied Volatility of the S&P (VXO) closed below the 10
level this month as investors buy every dip and remain extremely
complacent. This is only the 4th time, since the VXO began in 1986, that
it closed at or below the 10 level on a monthly basis. Furthermore it's
also the lowest monthly close on record.
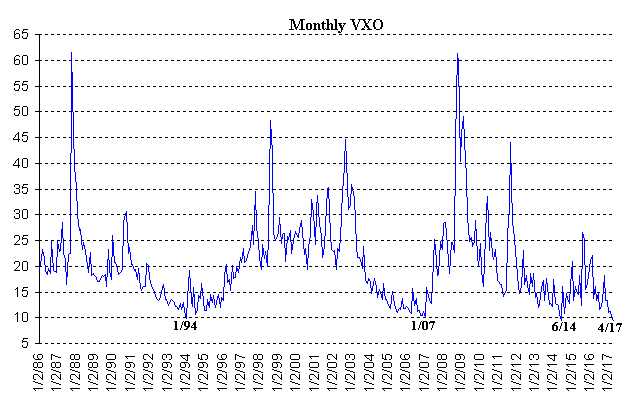
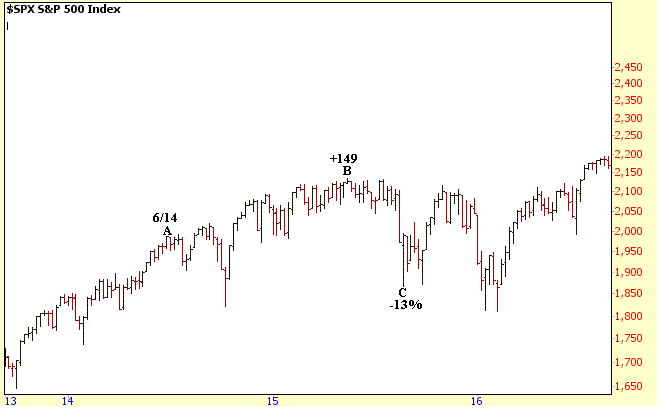
As we saw in the Summer of 2014, the extremely low reading in
the VXO was followed by an increase in volatility. However, the S&P
500 was still able to move higher (points A to B) and gain an additional 149
points (7%), before a more significant correction (13% drop) occurred in the
Summer and Fall of 2015 (points B to C).
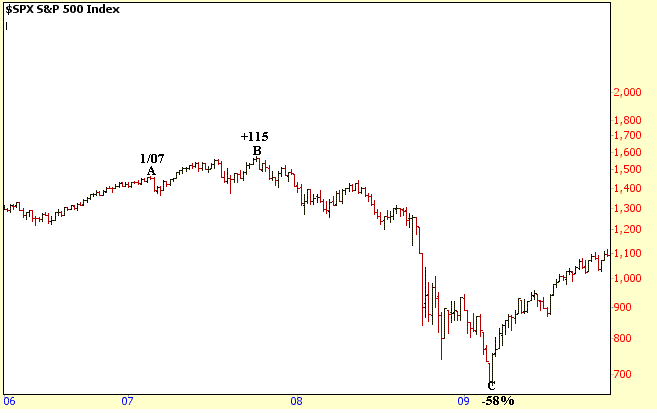
Meanwhile, back in early 2007, the S&P 500 saw increasing
volatility as well but was still able to rise another 115 points (8%) before
peaking in October of 2007 (points A to B). This was then followed by the
a major correction through the early part of 2009 (points B to C) in which the
S&P 500 lost 58%.
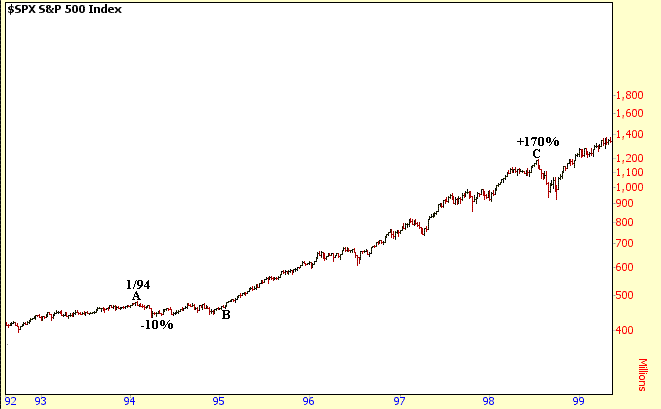
Finally, in early 1994, the VXO also closed near the 10 level on
a monthly basis. In this case the S&P 500 traded nearly sideways for a
year and never lost more than 10%. This was then followed by a breakout in
1995, with the S&P 500 moving steadily higher through the Summer of 1998
(points B to C), in which it gained nearly 170%.
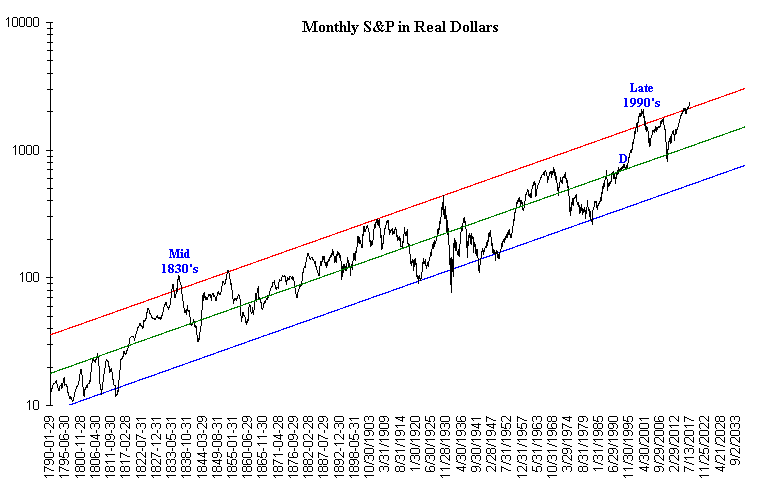
Currently the S&P 500, in terms of real dollars, remains
above the top of its upward channel (red line) and is extremely overbought from
a historical perspective. As I have said before only the periods in the
late 1990's and way back in the mid 1830's were more overbought than
today. With the S&P above its longer term channel it's highly
unlikely, in my opinion, there will be a repeat of the 1995 through 1998 period
in which the S&P gained nearly 170%. Back in early 1995 the S&P in
real dollars was still well below the top of its upward channel (point
D).
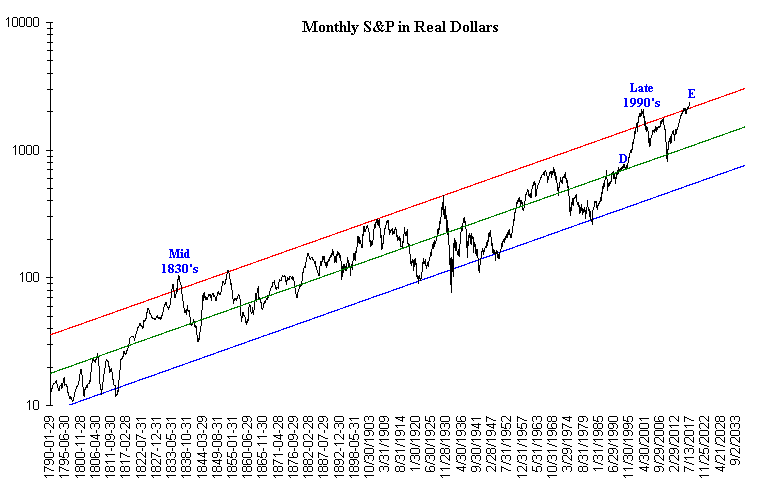
Thus the more likely outcome is like that of 2014 or 2007 in
which there would be a 7% to 8% rise from current levels. This would lead
to a target area near 2600 if a similar outcome occurred. In addition a
rally up to the 2600 level (point E) would make it as overvalued as what
occurred in the late 1990's and mid 1830's.
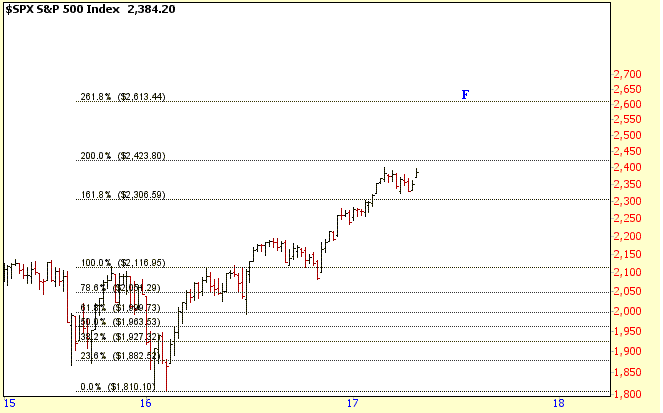
Furthermore a rise up to the 2600 level is also the 261.8%
Extension Level (point F) from the early 2016 low . Keep in mind this
would be the most bullish scenario for the S&P 500.
Amateur Investors
|


