|
Weekend Market Analysis
(12/20/03)
The Market
Over the past four weeks the Dow and S&P 500 have been
outperforming the Nasdaq as the technology sector has been under some selling
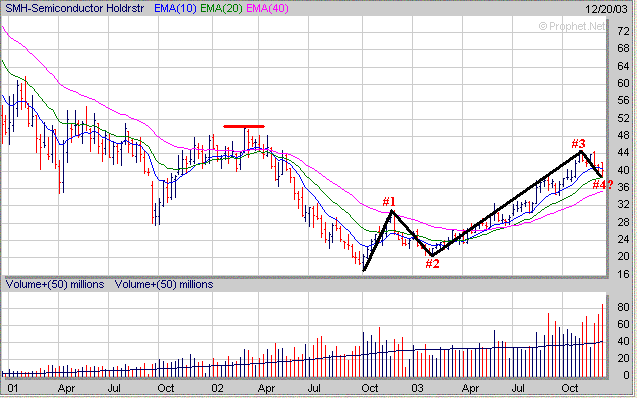
pressure. A look at the Semiconductors Holders (SMH) shows that this
sector has been under selling pressure 5 out of the last 6 weeks accompanied by
strong volume, however, so far the SMH's have been able to hold support at their
20 Weekly EMA near 38.50. Meanwhile it also appears the SMH's could be
undergoing a corrective 4th Wave for those that follow Elliot Wave
Theory.
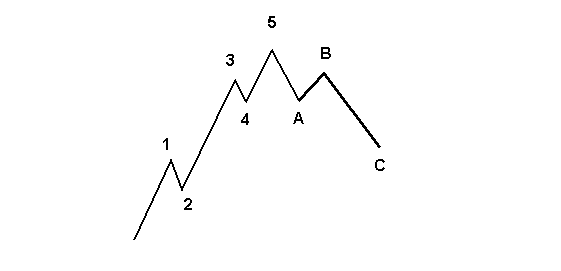
Once again without getting too technical a brief example of a what an Elliot
5 Wave Pattern looks like is shown below. Notice how Waves 1, 3 and 5
are upward moves with Wave 3 lasting the longest while Wave 5 is the shortest.
Meanwhile also notice that Waves 2 and 4 are corrective Waves which only last
for a brief period of time before the upward trend continues. If the
SMH's are currently going through a corrective 4th Wave then based on Elliot
Wave Theory there could be one more upward move (5th Wave) before a more
substantial correction occurs.
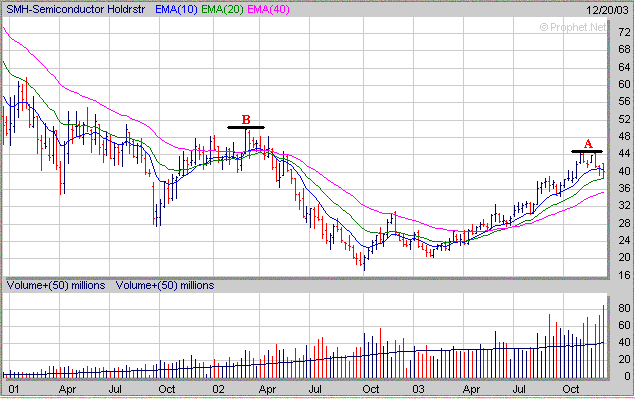
If a 5th Wave does eventually develop in the SMH's and they can
break above their previous resistance in the 44 area (point A) then in the
longer term it's possible they could rally up to the 50-51 range (point B) which
is the longer term 38.2% Retracement Level from the early 2000 high to the 2002
low. In addition the 50-51 area also corresponds to the high made in 2002
as well.
Meanwhile if the SMH's fail to hold support at their 20 Weekly
EMA near 38.50 then look for a quick drop back to their 40 Weekly EMA (purple
line) just below the 36 level.
As mentioned in the beginning both the Dow and S&P 500 have
been outperforming the Nasdaq over the past month. The Nasdaq has been
basically stuck in a trading range since October between 1880 and 2000.
Eventually the Nasdaq will break out of this trading range and make a
substantial move in one direction or the other. Of course the big question
is which direction will it go? At this point there are two possible
scenario's. If the Nasdaq can break above solidly above the 2000 level
this could lead to a quick move up to the 2050-2100 range (point C). The
2050 area corresponds to the longer term 23.6% Retracement Level calculated from
the early 2000 high to the 2002 low while the 2100 level was near the high made
in January of 2002. Meanwhile if the Nasdaq breaks below the
bottom of its recent trading range around 1880 which is also near its 20 Weekly
EMA then it could quickly drop back to its 40 Weekly EMA (purple line) near
1760. The Semiconductor sector will likely have a big impact on
which direction the Nasdaq will trend in the weeks ahead so as talked about
above watch the SMH's closely. 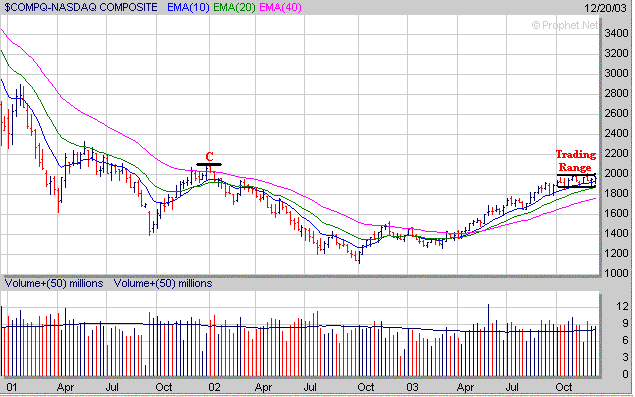
As for the other two averages the
Dow has been trending higher over the past 4 week and now has risen solidly
above its longer term 61.8% Retracement (calculated from the 2000 high to the
2002 low) near 10000. The Dow could run into some minor resistance near
10400 however there is a much more significant area of upside resistance near
10700 which is the longer term 76.4% Retracement Level and also coincides with
the high made in 2002 (point D). Meanwhile
it appears the Dow is still exhibiting a Wave 3 pattern and it will be
interesting to see if it can rally up to the 10700 area in the longer term
before a corrective 4th Wave occurs. 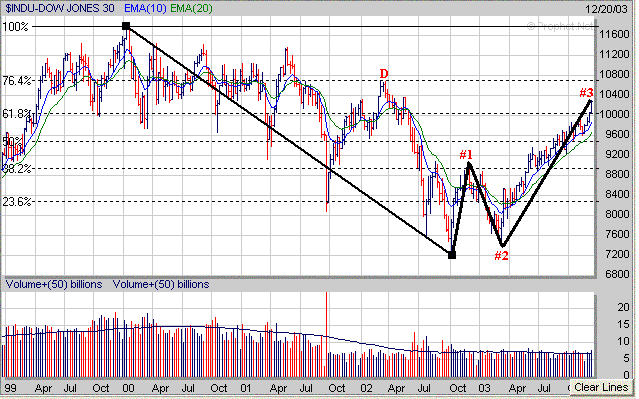
The S&P 500 has risen solidly
above its longer term 38.2% Retracement Level near 1065 and could run into some
minor resistance as it approaches the 1110 area. However there is a
more substantial area of upside resistance in the 1155 to 1170 range (point
E). The 1155 area is the longer term 50% Retracement Level while the 1170
area was near the high made in 2002. Meanwhile just like the Dow
it appears the S&P 500 is also exhibiting a Wave 3 pattern and the question
is will it undergo a corrective 4th Wave before it reaches the 1155-1170 area or
after? 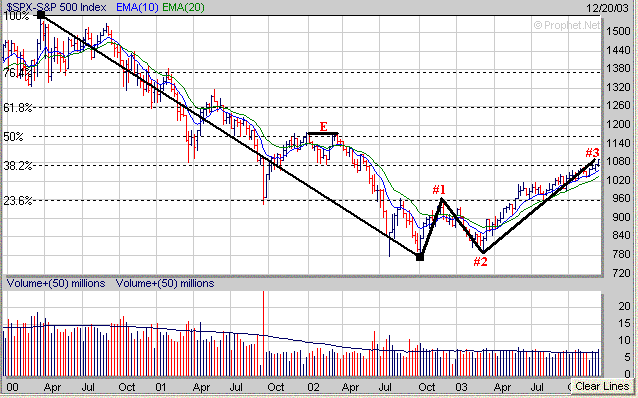
Stocks to Watch
(All charts are weekly unless denoted otherwise)
There still a
number of stocks that are exhibiting a favorable chart pattern and if the Nasdaq
can break out of its 10 week trading range to the upside I would imagine we will
see quite a few breakouts in the weeks ahead. Of course if the Nasdaq
breaks out to the downside instead then there won't be many stocks breaking out
to the upside. For those of you that trade the Exchange Traded
Funds (ETF's) I would pay close attention to the QQQ's which have also trading
sideways over the past 10 weeks. The QQQ's will likely gives us either a
long or short entry before much longer. If the QQQ's can break out if
their trading range and above the 36 level then this would give you a long
opportunity with a potential rise up to the 39-43 range. The 43 level
(point A) is the longer term 38.2% Retracement Level which is also coincides
with the high made in the late part of 2001 and the early part of 2002. Meanwhile
if the QQQ's break below the bottom of their trading range near 34 this may give
you a good shorting opportunity as they will likely drop quickly back to their
40 Weekly EMA (purple line) near 32. 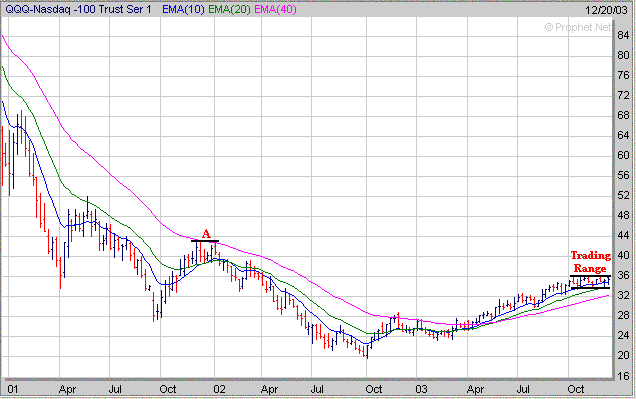
As far as some individual stocks to
watch ALDN has developed a 9 week Handle (H) with its Pivot POint near $10. 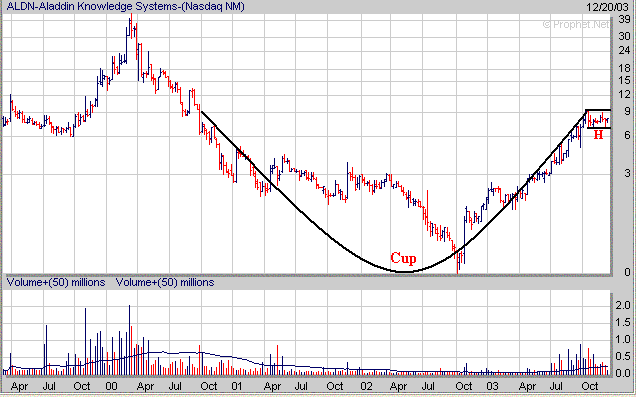
ATYT has developed a 14 week
Handle. Its Pivot Point remains around $16.50. 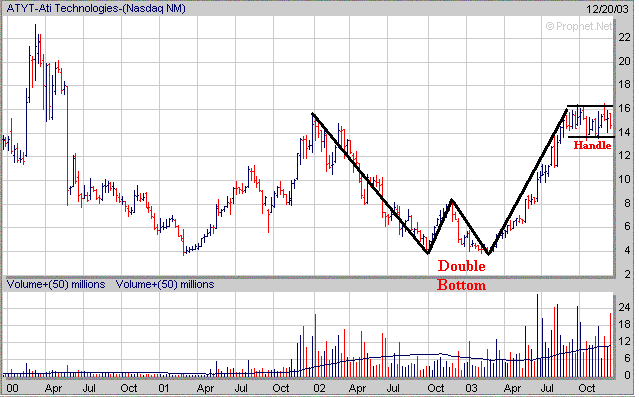
FNDT has developed a 7 week Handle
(H). Its Pivot Point remains around $8.50. 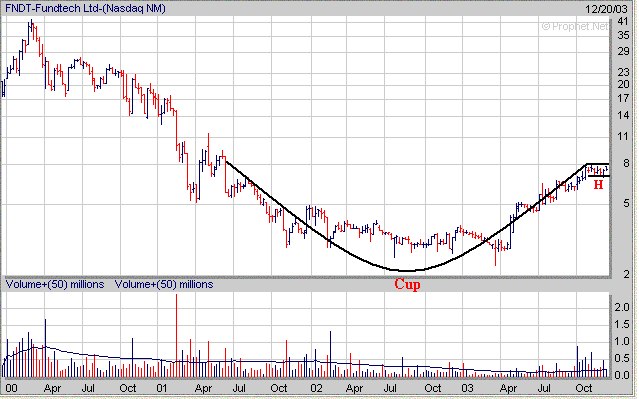
HANS is still exhibiting a Pennant
pattern and needs to be watched for a breakout above $9. 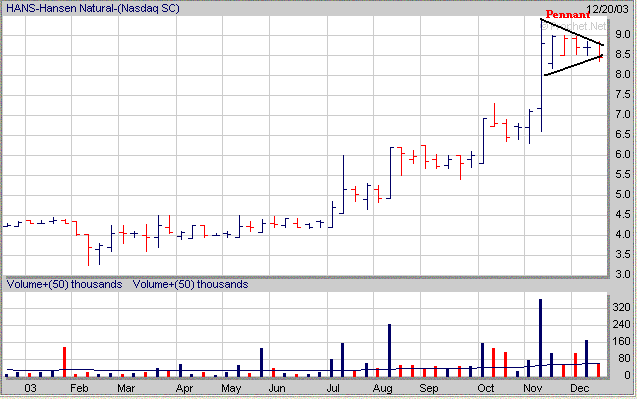
MTXX has developed a 4 week Handle
(H). Its Pivot Point remains around $17.75. 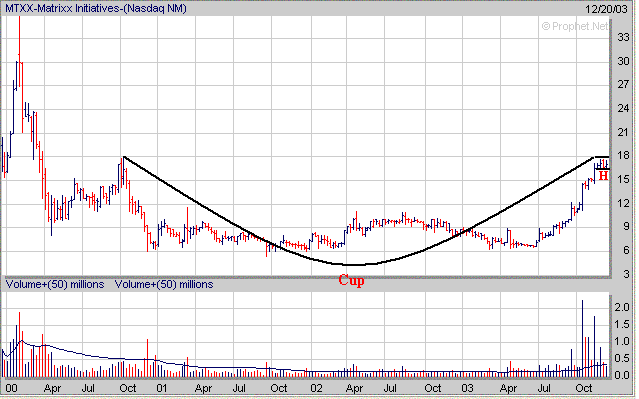
NITE has developed a 10 week
Handle (H). Its Pivot Point remains around $15.25. 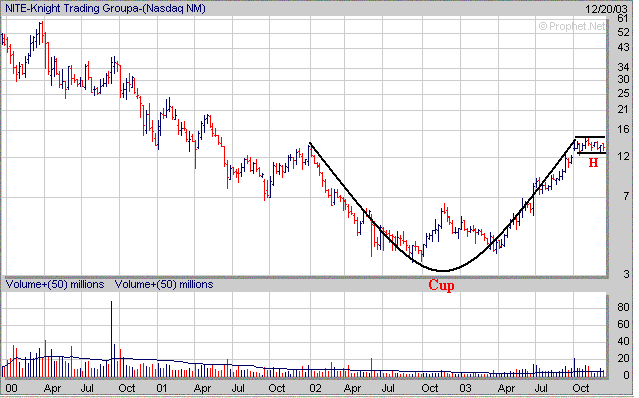
SCIX has developed a 3 week Handle
(H). Its Pivot Point remains around $5.50. 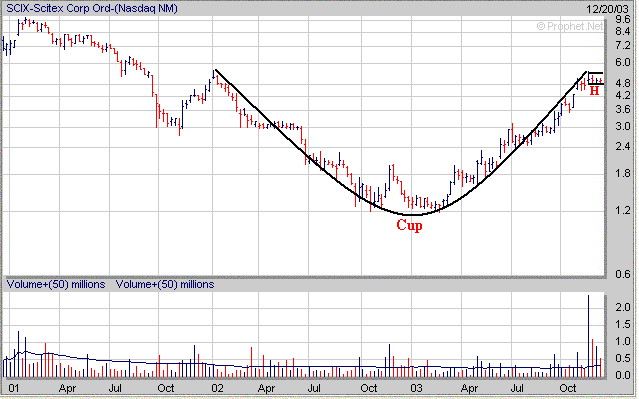
SCUR has developed a 6 week Handle
(H). Its Pivot Point remains around $15.75. 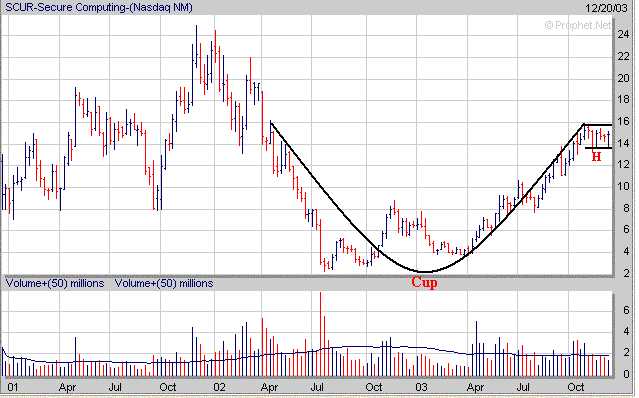
THER has developed an 8 week
Handle (H). Its Pivot Point remains around $19. 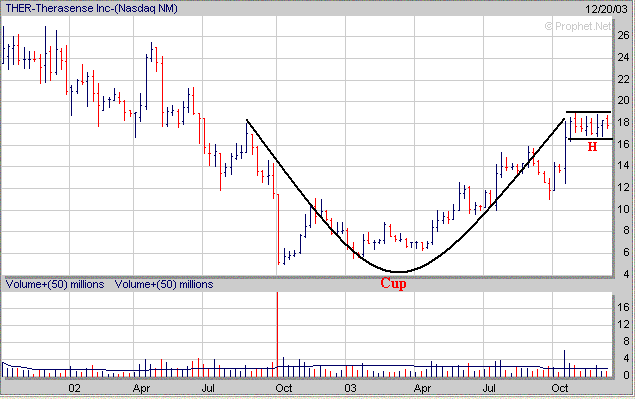
VTIV has developed a 5 week Handle
(H). Its Pivot Point remains around $10. 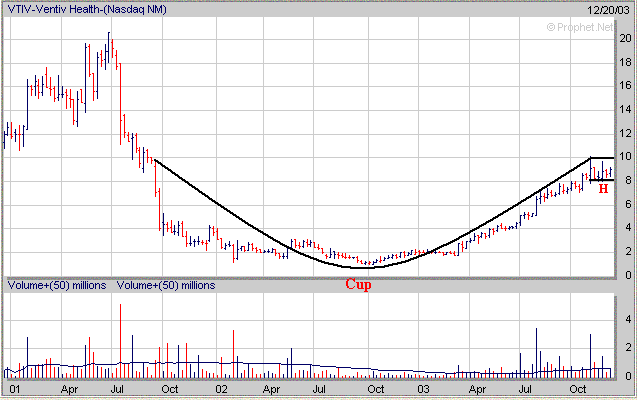
WIRE has developed a 7 week Handle
(H). Its Pivot Point remains around $18.50. 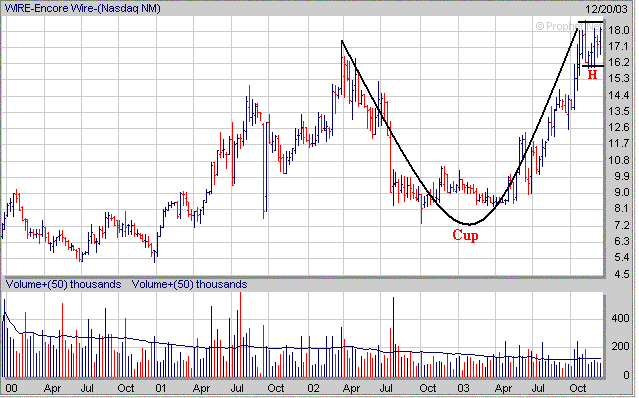
If you decide to take a position in any of these make sure they
break above their Pivot Points first and also have a proper Stop Loss Order in
place just in case the breakout attempt fails to follow through.
| Stock Deleted
from AII Top 100 |
Stocks Added to
AII Top 100 |
| ALOT, AMI, SPIL,
UOPX |
CAMD, DGIN, NTPA,
TRO |
Amateur-Investor.net
|


