|
(12/16/08)
The market rallied strongly Tuesday afternoon after the Fed
Announcement however volume was on the low side so that is something that will
have to be watched over the next few days. Overall the S&P 500
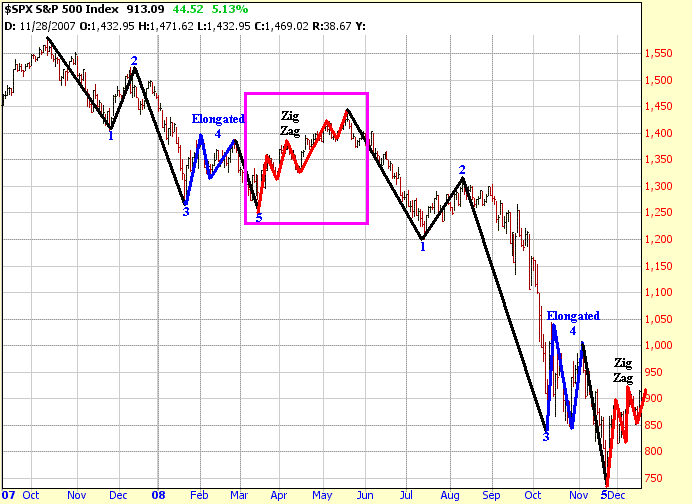
is still exhibiting a Zig Zag corrective rally after completing its most recent
Elliott 5 Wave pattern to the downside. Keep in mind we saw a similar
pattern occur last Spring after the S&P 500 completed its 1st Elliott 5 Wave
pattern to the downside which was followed by a 2 month Zig Zag corrective rally
(highlighted by purple rectangle). 
As I have talked
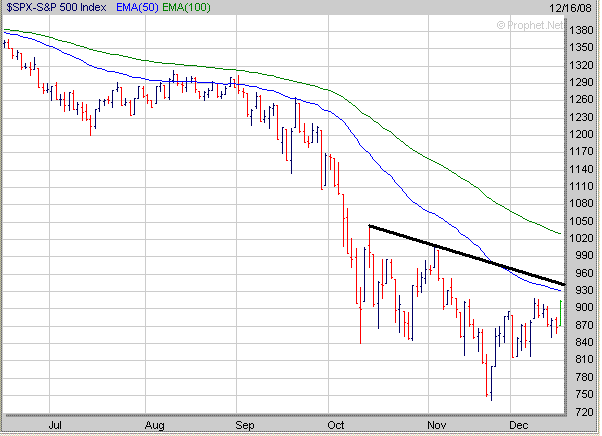
about in the Daily Updates I expect the S&P 500 is going to encounter strong
resistance over the next day or two in the 930 to 940 range if it continues
higher. The 930 level is where the S&P 500's 50 Day EMA (blue
line) is at while the 940 level is along the downward trend line (black line)
connecting the October 14th and November 4th highs. My guess is the
S&P 500 will stall out somewhere in the 930 to 940 range in the near term
and then go through another substantial pullback. 
Meanwhile
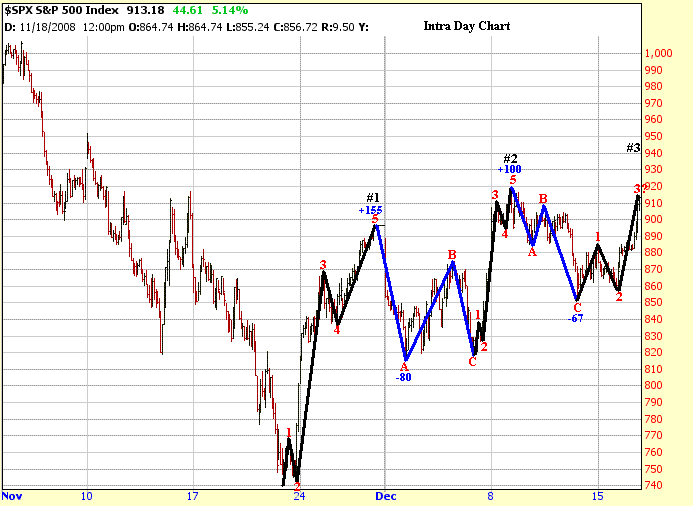
on an intra day chart it appears the S&P 500 is exhibiting another smaller 5
Wave pattern which is the 3rd one since the November 21st low. The
first 5 Wave pattern ended with a 155 point gain in the S&P 500 while the
2nd one ended with a 100 point gain. Once again I expect this latest
5 Wave pattern (#3) on an intra day scale will complete itself in the 930 to 940
range before the week ends. 
With the big move
on Tuesday I really don't see chasing the market higher over the next day or two
for those following my Daily ETF Signals. In fact I will be looking for a
potential Shorting Opportunity once the S&P 500 reaches the 930 to 940
range.
Amateur Investors
|


