|
(10/22/13)
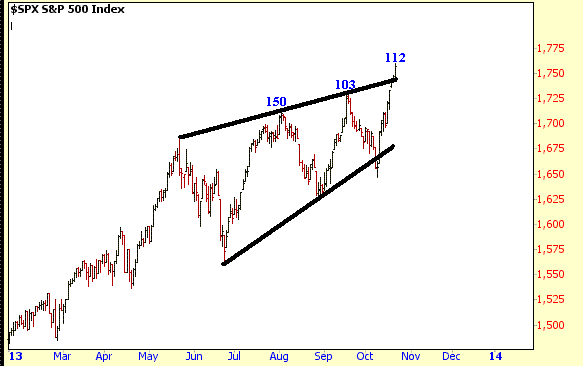
It's just astonishing how this market responds to bad economic
news as the belief is the Federal Reserve will just keep printing money to
infinity. The wedge pattern is eliminated as the final wave up can't
be longer in length than the 3rd Wave which was 103 points.  Meanwhile the
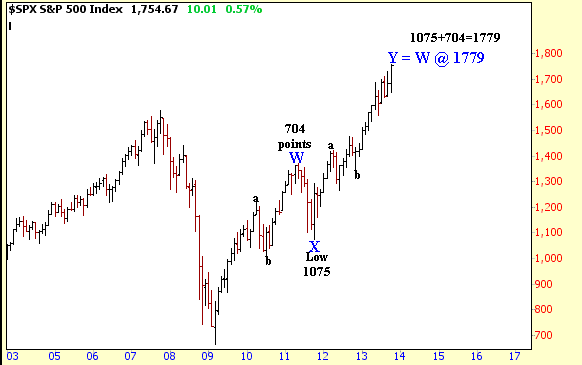
entire move from the March 2009 low looks like a large "WXY" Double
Zig Zag. If the length of "Y" = the length of "W" that
yields 1779 (704 + 1075). So we are roughly 25 points away from that
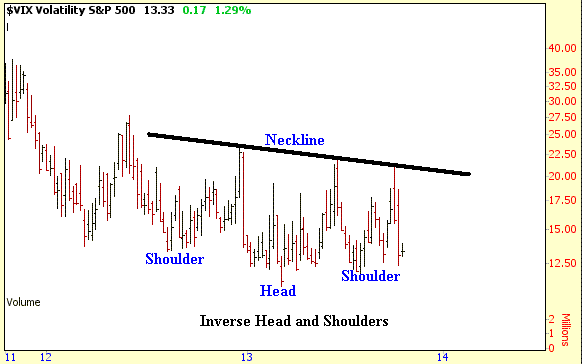
level.  Finally the
Volatility Index (VIX) is developing a large Inverse Head and Shoulders pattern
so it looks like a big upward move may occur in 2014 which would coincide with a
sizeable correction in the market as well. 
Wednesday's
Buy Signals
| Primary |
Secondary |
RSI |
Williams |
Fisher |
TRIN |
Volatility |
Money |
Money |
Put to |
VWAP |
Advance |
Signal |
| RSI
Long |
RSI
Long |
Max/Min |
%R |
Transform |
S&P 500 |
Bands |
Flow |
Flow/
TRIN |
Call Ratio |
|
Decline |
Strength |
| Signal |
Signal |
Signal |
Signal |
Signal |
Signal |
Signal |
Signal |
Signal |
Signal |
Signal |
Ratio |
|
| No |
No |
No |
No |
No |
No |
No |
No |
No |
No |
No |
No |
|
When 6 or more Signals are generated that is a Strong Buy
Signal
When 3 to 5 Signals are generated that is a Moderate Buy Signal
When only 1 or 2 Signals are generated that is a Weak Buy Signal
Wednesday's Sell Signals
| Advance |
Fisher |
ROC |
RSI |
VWAP |
Volatility |
Volatility |
TRIN |
Signal |
| Decline |
Transform |
VWAP |
Max |
Percent |
Index |
Bands |
S&P 500 |
Strength |
| Ratio |
Signal |
Signal |
Signal |
Signal |
Signal |
Signal |
Signal |
|
| No |
No |
No |
No |
No |
No |
No |
No |
|
When 5 or more Signals are generated that is a Strong
Sell Signal
When 3 to 4 Signals are generated that is a Moderate Sell Signal
When only 1 or 2 Signals are generated that is a Weak Sell Signal
When a Buy or Short Signal is triggered numbers will be entered into the table
below.
| ETF |
Wednesday's |
Buy/Short
Signal |
Entry |
Initial
Stop |
Trailing
Stop |
1st
Target |
2nd
Target |
3rd |
| Target |
|
Signals |
Date |
Price |
Price |
Price |
Price |
Price |
Price |
| SPY |
|
|
|
|
|
|
|
|
Amateur Investors
| 


