|
(5/16/17)
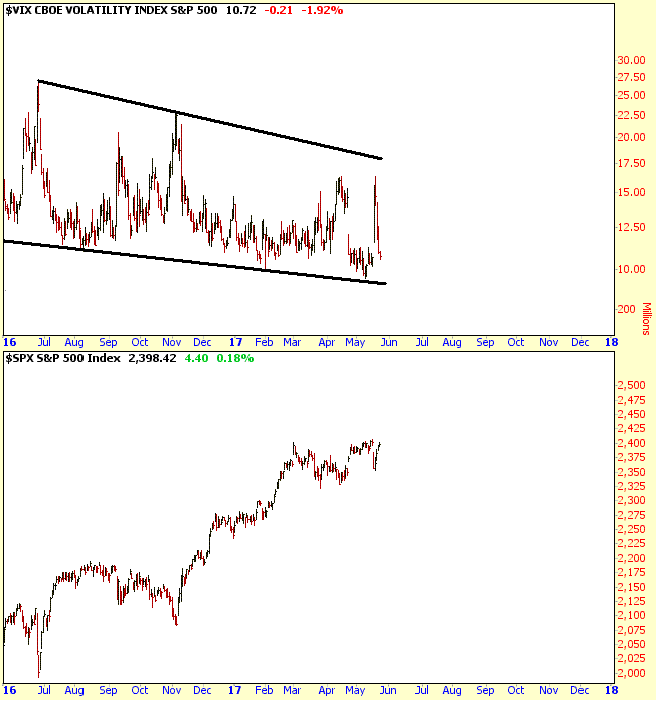
After last Wednesday's 1.8% drop, the S&P 500 has rallied
the past 4 days as the VIX has tumbled once again without testing the upper
portion of its descending channel. 
Finally
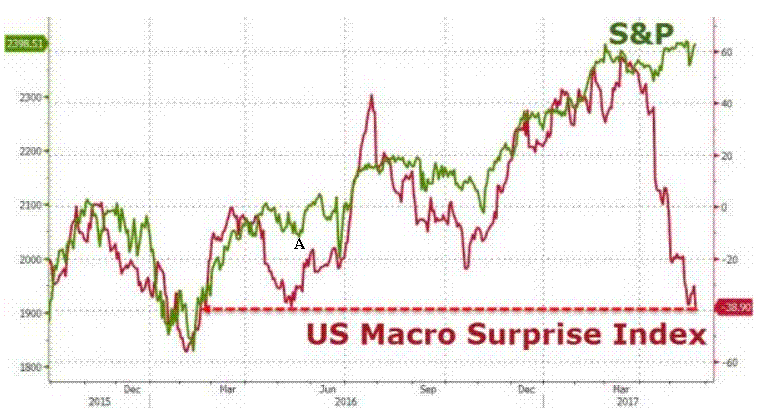
the market is certainly out of touch with reality. The chart from
zerohedge shows the US Macro Surprise Index is collapsing as the S&P 500
remains near all time highs. Notice the Macro Surprise Index and S&P
500 generally move in the same direction but have diverged considerably the past
few months. The last time the Macro Surprise Index was this low the
S&P 500 was near the 2050 level (point A). 
Wednesday's
Buy Signals
| Primary |
Secondary |
RSI |
Williams |
Fisher |
TRIN |
Volatility |
Money |
Money |
Put to |
VWAP |
Advance |
Signal |
| RSI
Long |
RSI
Long |
Max/Min |
%R |
Transform |
S&P 500 |
Bands |
Flow |
Flow/
TRIN |
Call Ratio |
|
Decline |
Strength |
| Signal |
Signal |
Signal |
Signal |
Signal |
Signal |
Signal |
Signal |
Signal |
Signal |
Signal |
Ratio |
|
| No |
No |
No |
No |
No |
No |
No |
No |
No |
No |
No |
No |
|
When 6 or more Signals are generated that is a Strong Buy
Signal
When 3 to 5 Signals are generated that is a Moderate Buy Signal
When only 1 or 2 Signals are generated that is a Weak Buy Signal
Wednesday's Sell Signals
| Advance |
Fisher |
ROC |
RSI |
VWAP |
Volatility |
Volatility |
TRIN |
Signal |
| Decline |
Transform |
VWAP |
Max |
Percent |
Index |
Bands |
S&P 500 |
Strength |
| Ratio |
Signal |
Signal |
Signal |
Signal |
Signal |
Signal |
Signal |
|
| No |
No |
No |
No |
No |
No |
No |
No |
|
When 5 or more Signals are generated that is a Strong
Sell Signal
When 3 to 4 Signals are generated that is a Moderate Sell Signal
When only 1 or 2 Signals are generated that is a Weak Sell Signal
When a Buy or Short Signal is triggered numbers will be entered into the table
below.
| ETF |
Wednesday's |
Buy/Short
Signal |
Entry |
Initial
Stop |
Trailing
Stop |
1st
Target |
2nd
Target |
3rd |
| Target |
|
Signals |
Date |
Price |
Price |
Price |
Price |
Price |
Price |
| SPY |
|
|
|
|
|
|
|
|
Amateur Investors
| 


