|
(7/22/13)
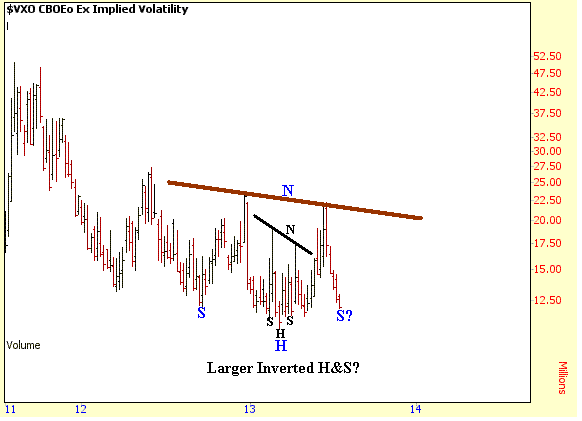
In the Spring the VXO developed a small Inverted Head and
Shoulders pattern which was followed by a 7.5% correction in the S&P
500. Currently it looks like the VXO may be forming an even larger
Inverted Head and Shoulders pattern. Thus this could eventually lead
to a much larger rise in the VXO if the Neckline (brown line) is taken out as we
move into the Fall. Naturally if the Inverted Head and Shoulders pattern
were to play out a decent correction would follow in the market. 
Tuesday's Buy Signals
| Primary |
Secondary |
RSI |
Williams |
Fisher |
TRIN |
Volatility |
Money |
Money |
Put to |
VWAP |
Advance |
Signal |
| RSI
Long |
RSI
Long |
Max/Min |
%R |
Transform |
S&P 500 |
Bands |
Flow |
Flow/
TRIN |
Call Ratio |
|
Decline |
Strength |
| Signal |
Signal |
Signal |
Signal |
Signal |
Signal |
Signal |
Signal |
Signal |
Signal |
Signal |
Ratio |
|
| No |
No |
No |
No |
No |
No |
No |
No |
No |
No |
No |
No |
|
When 6 or more Signals are generated that is a Strong Buy
Signal
When 3 to 5 Signals are generated that is a Moderate Buy Signal
When only 1 or 2 Signals are generated that is a Weak Buy Signal
Tuesday's Sell Signals
| Advance |
Fisher |
ROC |
RSI |
VWAP |
Volatility |
Volatility |
TRIN |
Signal |
| Decline |
Transform |
VWAP |
Max |
Percent |
Index |
Bands |
S&P 500 |
Strength |
| Ratio |
Signal |
Signal |
Signal |
Signal |
Signal |
Signal |
Signal |
|
| No |
No |
No |
No |
No |
No |
No |
No |
|
When 5 or more Signals are generated that is a Strong
Sell Signal
When 3 to 4 Signals are generated that is a Moderate Sell Signal
When only 1 or 2 Signals are generated that is a Weak Sell Signal
When a Buy or Short Signal is triggered numbers will be entered into the table
below.
| ETF |
Tuesday's |
Buy/Short
Signal |
Entry |
Initial
Stop |
Trailing
Stop |
1st
Target |
2nd
Target |
3rd |
| Target |
|
Signals |
Date |
Price |
Price |
Price |
Price |
Price |
Price |
| SPY |
|
|
|
|
|
|
|
|
Amateur Investors
| 


