|
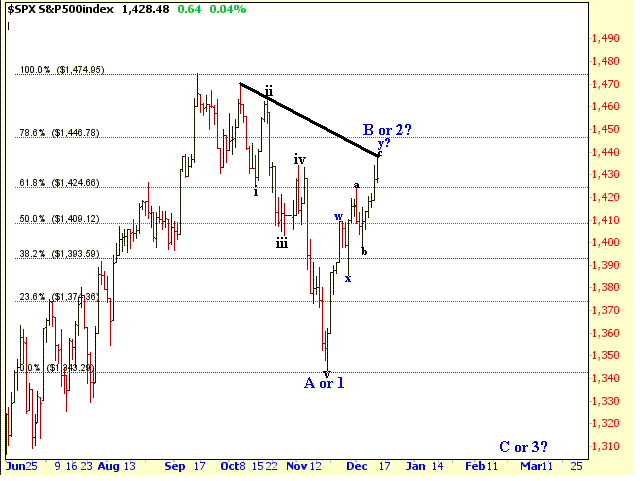
(12/12/12)
The S&P 500 rallied up to the upper 1430's which was along the downward
sloping trend line. In addition if we are seeing a simple Zig Zag
for "y" then the length of "c" equaled the
length of "a" in the upper 1430's as well. Thus from a wave
perspective either Wave 2 of a larger 5 Wave pattern or "B" of a
larger corrective "ABC" affair may have peaked today.
 Thursday's Buy Signals
| Primary |
Secondary |
RSI |
Williams |
Fisher |
TRIN |
Volatility |
Money |
Money |
Put to |
VWAP |
Advance |
Signal |
| RSI
Long |
RSI
Long |
Max/Min |
%R |
Transform |
S&P 500 |
Bands |
Flow |
Flow/
TRIN |
Call Ratio |
|
Decline |
Strength |
| Signal |
Signal |
Signal |
Signal |
Signal |
Signal |
Signal |
Signal |
Signal |
Signal |
Signal |
Ratio |
|
| No |
No |
No |
No |
No |
No |
No |
No |
No |
No |
No |
No |
|
When 6 or more Signals are generated that is a Strong Buy
Signal
When 3 to 5 Signals are generated that is a Moderate Buy Signal
When only 1 or 2 Signals are generated that is a Weak Buy Signal
Thursday's Sell Signals
| Advance |
Fisher |
ROC |
RSI |
VWAP |
Volatility |
Volatility |
TRIN |
Signal |
| Decline |
Transform |
VWAP |
Max |
Percent |
Index |
Bands |
S&P 500 |
Strength |
| Ratio |
Signal |
Signal |
Signal |
Signal |
Signal |
Signal |
Signal |
|
| No |
No |
No |
No |
No |
No |
No |
No |
|
When 5 or more Signals are generated that is a Strong
Sell Signal
When 3 to 4 Signals are generated that is a Moderate Sell Signal
When only 1 or 2 Signals are generated that is a Weak Sell Signal
When a Buy or Short Signal is triggered numbers will be entered into the table
below.
| ETF |
Thursday's |
Buy/Short
Signal |
Entry |
Initial
Stop |
Trailing
Stop |
1st
Target |
2nd
Target |
3rd |
| Target |
|
Signals |
Date |
Price |
Price |
Price |
Price |
Price |
Price |
| SPY |
|
|
|
|
|
|
|
|
Amateur Investors
| 
