|
(4/2/14)
With all of the rhetoric about how April is the best performing
month for the market it would be fitting for the market to exhibit weakness
after this week is done. The S&P Futures are developing a rare bearish
Butterfly pattern in the near term.
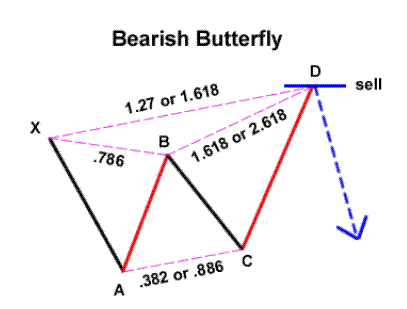
The
length of XA was 57 points so if the CD leg is 1.27 of XA that yields 1896 which
is roughly 10 points above today's intra day high of 1886. 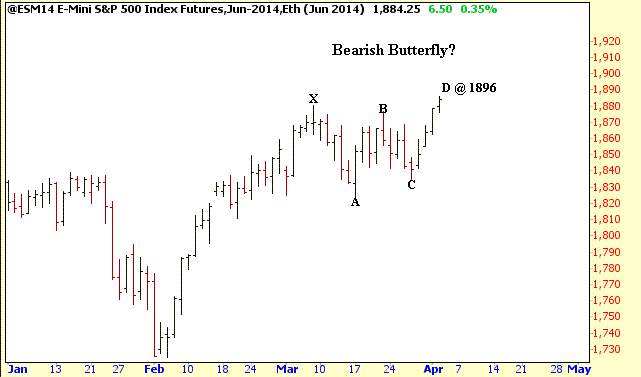
Thursday's
Buy Signals
| Primary |
Secondary |
RSI |
Williams |
Fisher |
TRIN |
Volatility |
Money |
Money |
Put to |
VWAP |
Advance |
Signal |
| RSI
Long |
RSI
Long |
Max/Min |
%R |
Transform |
S&P 500 |
Bands |
Flow |
Flow/
TRIN |
Call Ratio |
|
Decline |
Strength |
| Signal |
Signal |
Signal |
Signal |
Signal |
Signal |
Signal |
Signal |
Signal |
Signal |
Signal |
Ratio |
|
| No |
No |
No |
No |
No |
No |
No |
No |
No |
No |
No |
No |
|
When 6 or more Signals are generated that is a Strong Buy
Signal
When 3 to 5 Signals are generated that is a Moderate Buy Signal
When only 1 or 2 Signals are generated that is a Weak Buy Signal
Thursday's Sell Signals
| Advance |
Fisher |
ROC |
RSI |
VWAP |
Volatility |
Volatility |
TRIN |
Signal |
| Decline |
Transform |
VWAP |
Max |
Percent |
Index |
Bands |
S&P 500 |
Strength |
| Ratio |
Signal |
Signal |
Signal |
Signal |
Signal |
Signal |
Signal |
|
| No |
No |
No |
No |
No |
No |
No |
No |
|
When 5 or more Signals are generated that is a Strong
Sell Signal
When 3 to 4 Signals are generated that is a Moderate Sell Signal
When only 1 or 2 Signals are generated that is a Weak Sell Signal
When a Buy or Short Signal is triggered numbers will be entered into the table
below.
| ETF |
Thursday's |
Buy/Short
Signal |
Entry |
Initial
Stop |
Trailing
Stop |
1st
Target |
2nd
Target |
3rd |
| Target |
|
Signals |
Date |
Price |
Price |
Price |
Price |
Price |
Price |
| SPY |
|
|
|
|
|
|
|
|
Amateur Investors
| 
